HOT TOPICS LIST
- MACD
- Fibonacci
- RSI
- Gann
- ADXR
- Stochastics
- Volume
- Triangles
- Futures
- Cycles
- Volatility
- ZIGZAG
- MESA
- Retracement
- Aroon
INDICATORS LIST
LIST OF TOPICS
PRINT THIS ARTICLE
by Austin Passamonte
As the Nasdaq 100 Index gets ready to replace some of its poor performers with new prospects, where is it positioned, technically speaking?
Position: N/A
Austin Passamonte
Austin is a private trader who trades emini stock index futures intraday. He currently trades various futures markets from home in addition to managing a trader's educational forum
PRINT THIS ARTICLE
SUPPORT & RESISTANCE
Balancing Act In The QQQ
12/18/01 10:35:33 AMby Austin Passamonte
As the Nasdaq 100 Index gets ready to replace some of its poor performers with new prospects, where is it positioned, technically speaking?
Position: N/A
| December 24th marks the annual Nasdaq 100 rebalancing act. Out with the old duds and in with current hot prospects. This periodic flushing keeps the index stoked with recent performers while shedding laggards out. While designed to keep the index vibrant & strong, is that enough to keep price action moving higher from here? |
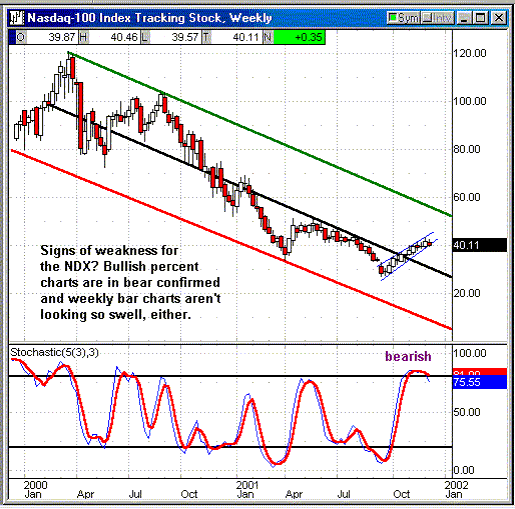
| NDX is still riding its historical channel down even though the trend for three months has been up. The first sign of that channel breaking (light blue lines) came last week and may not be able to climb too much higher towards overhead resistance above unless it does so soon. |

|
| Figure 1: Weekly Chart: NDX |
| Graphic provided by: Quote.com. |
| Graphic provided by: QCharts. |
| |
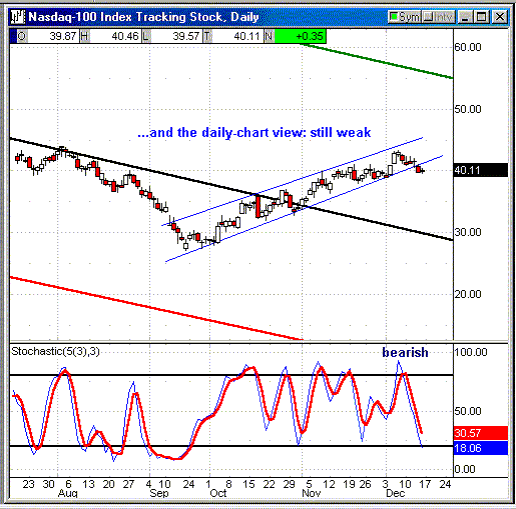
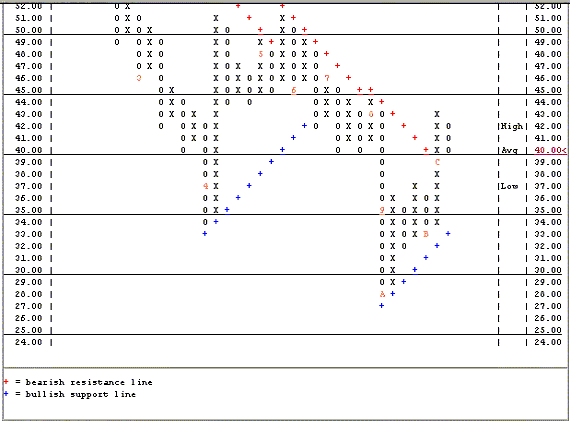
Also, the NDX entered bear confirmed status in point & figure charting last week in harmony with what we see in its charts. Figure 2: Daily Chart: QQQ |
This is the same exact chart, time frame switched to daily. Stochastic values are bearish in techs and that three-month channel just failed. It could easily pop higher and reenter the ascent this week, but new measures of overhead resistance fell in place when price action broke down.  Figure 3: Daily P&F Chart: QQQ Graphics Courtesy of Stockcharts.com |
| The 40.00 level for QQQ symbol is a relatively important downward trendline of support. So far it has held and needs to do so if upward action has a chance from here. The 35.00 area is the next strong support backed up by 34 area from there. We see where the growing wedge broke with four Xs up but then promptly pulled back when giving up three Os after that. An upward reversal using 40.00 area as a pivot is most likely, but break below 39.00 would have traders looking toward the mid 30s for support from there. Will rebalancing with biotechs swapped for ragged telecom issues thwart recent weakness? Don't know for sure, but our trusty charts will surely tell! |
Austin is a private trader who trades emini stock index futures intraday. He currently trades various futures markets from home in addition to managing a trader's educational forum
| Title: | Individual Trader |
| Company: | CoiledMarkets.com |
| Address: | PO Box 633 |
| Naples, NY 14512 | |
| Website: | coiledmarkets.com/blog |
| E-mail address: | austinp44@yahoo.com |
Traders' Resource Links | |
| CoiledMarkets.com has not added any product or service information to TRADERS' RESOURCE. | |
Click here for more information about our publications!
Comments
Date: 12/21/01Rank: 4Comment:
Date: 12/26/01Rank: 4Comment:
Date: 12/28/01Rank: 5Comment:
Date: 12/30/01Rank: 4Comment: This detailed info.confirms my view
Date: 01/01/02Rank: 4Comment:

Request Information From Our Sponsors
- StockCharts.com, Inc.
- Candle Patterns
- Candlestick Charting Explained
- Intermarket Technical Analysis
- John Murphy on Chart Analysis
- John Murphy's Chart Pattern Recognition
- John Murphy's Market Message
- MurphyExplainsMarketAnalysis-Intermarket Analysis
- MurphyExplainsMarketAnalysis-Visual Analysis
- StockCharts.com
- Technical Analysis of the Financial Markets
- The Visual Investor
- VectorVest, Inc.
- Executive Premier Workshop
- One-Day Options Course
- OptionsPro
- Retirement Income Workshop
- Sure-Fire Trading Systems (VectorVest, Inc.)
- Trading as a Business Workshop
- VectorVest 7 EOD
- VectorVest 7 RealTime/IntraDay
- VectorVest AutoTester
- VectorVest Educational Services
- VectorVest OnLine
- VectorVest Options Analyzer
- VectorVest ProGraphics v6.0
- VectorVest ProTrader 7
- VectorVest RealTime Derby Tool
- VectorVest Simulator
- VectorVest Variator
- VectorVest Watchdog
