HOT TOPICS LIST
- MACD
- Fibonacci
- RSI
- Gann
- ADXR
- Stochastics
- Volume
- Triangles
- Futures
- Cycles
- Volatility
- ZIGZAG
- MESA
- Retracement
- Aroon
INDICATORS LIST
LIST OF TOPICS
PRINT THIS ARTICLE
by Chaitali Mohile
Can the consolidation in the Dow Jones Industrial Average maintain its bullishness?
Position: N/A
Chaitali Mohile
Active trader in the Indian stock markets since 2003 and a full-time writer. Trading is largely based upon technical analysis.
PRINT THIS ARTICLE
FLAGS AND PENNANTS
DIA Consolidates
04/08/10 01:19:45 PMby Chaitali Mohile
Can the consolidation in the Dow Jones Industrial Average maintain its bullishness?
Position: N/A
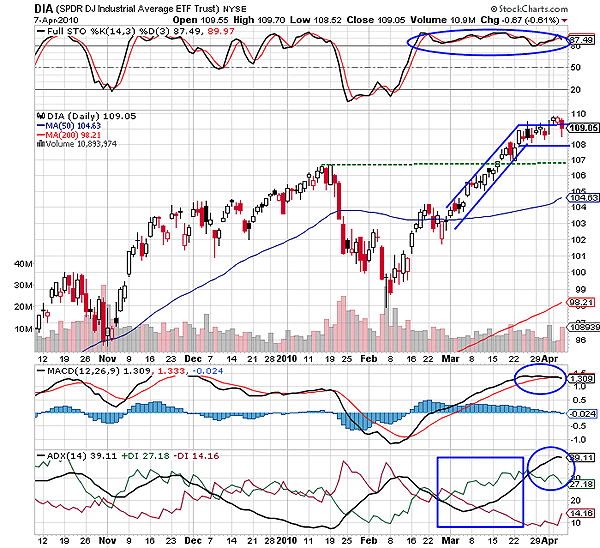
| After the 50-day moving average (MA) converted from resistance to support, SPDR Dow Jones Industrial Average (DIA) underwent a robust upward rally in March. The MA breakout of DIA initiated a fresh bull trend and boosted price movement. The big green box in Figure 1 shows the average directional movement index (ADX) (14) shifting in favor of bulls, indicating a developing uptrend. DIA gained nearly five points after the breakout at 104 levels. Later, the index turned sideways in a narrow range between 108 and 109. During the rally, volume remained calm and steady, while the consolidation period saw nominal volatility. After an extensive advance rally, the sideways rally of DIA formed a bullish flag & pennant in Figure 1. Since the pattern is a continuation pattern, the breakout resumed the existing bullish rally. |

|
| FIGURE 1: DIA, DAILY. The consolidation after an advance rally formed the bullish flag & pennant formation for DIA. The previous high and the 50-day MA are the major support if the index breached the lower consolidation range. |
| Graphic provided by: StockCharts.com. |
| |
| The length of the flagpole (104-109) 5 plus the breakout point at 109 results in a breakout target of 114, so the potential breakout is the best buy setup for traders. However, the technical chart signifies that the index is likely to consolidate further and the period is likely to be volatile. We can see that the full stochastic (14,3,3) in Figure 1 has been overbought for more than a month. Usually, the momentum lowers if the oscillator sustains in an extreme region longer. Therefore, the stochastic may slip from a highly overbought level and affect the consolidated move. The moving average convergence/divergence (MACD) (12,26,9) has touched the trigger, and the overheated uptrend is likely to descend in the developed area. Thus, DIA is not likely to break out recently but would consolidate in a volatile atmosphere. |
| However, the bullishness of DIA would sustain and definitely break out as the indicators turned healthily bullish. The descending move of the full stochastic (14,3,3) in the bullish area would create space for the future breakout rally. If the index penetrates the lower consolidation range, the support at 107 would prevent damage. The 50-day MA would be the ultimate short-term support in a worst-case scenario. |
Active trader in the Indian stock markets since 2003 and a full-time writer. Trading is largely based upon technical analysis.
| Company: | Independent |
| Address: | C1/3 Parth Indraprasth Towers. Vastrapur |
| Ahmedabad, Guj 380015 | |
| E-mail address: | chaitalimohile@yahoo.co.in |
Traders' Resource Links | |
| Independent has not added any product or service information to TRADERS' RESOURCE. | |
Click here for more information about our publications!
Comments
Date: 04/12/10Rank: 2Comment:

Request Information From Our Sponsors
- StockCharts.com, Inc.
- Candle Patterns
- Candlestick Charting Explained
- Intermarket Technical Analysis
- John Murphy on Chart Analysis
- John Murphy's Chart Pattern Recognition
- John Murphy's Market Message
- MurphyExplainsMarketAnalysis-Intermarket Analysis
- MurphyExplainsMarketAnalysis-Visual Analysis
- StockCharts.com
- Technical Analysis of the Financial Markets
- The Visual Investor
- VectorVest, Inc.
- Executive Premier Workshop
- One-Day Options Course
- OptionsPro
- Retirement Income Workshop
- Sure-Fire Trading Systems (VectorVest, Inc.)
- Trading as a Business Workshop
- VectorVest 7 EOD
- VectorVest 7 RealTime/IntraDay
- VectorVest AutoTester
- VectorVest Educational Services
- VectorVest OnLine
- VectorVest Options Analyzer
- VectorVest ProGraphics v6.0
- VectorVest ProTrader 7
- VectorVest RealTime Derby Tool
- VectorVest Simulator
- VectorVest Variator
- VectorVest Watchdog
