HOT TOPICS LIST
- MACD
- Fibonacci
- RSI
- Gann
- ADXR
- Stochastics
- Volume
- Triangles
- Futures
- Cycles
- Volatility
- ZIGZAG
- MESA
- Retracement
- Aroon
INDICATORS LIST
LIST OF TOPICS
PRINT THIS ARTICLE
by Chaitali Mohile
The bullish rally of the Industrial Select Sector has turned down various forms of resistance formed by the previous corrective rally. How far can the index run?
Position: N/A
Chaitali Mohile
Active trader in the Indian stock markets since 2003 and a full-time writer. Trading is largely based upon technical analysis.
PRINT THIS ARTICLE
SUPPORT & RESISTANCE
New Support Of XLI
04/07/10 10:23:16 AMby Chaitali Mohile
The bullish rally of the Industrial Select Sector has turned down various forms of resistance formed by the previous corrective rally. How far can the index run?
Position: N/A
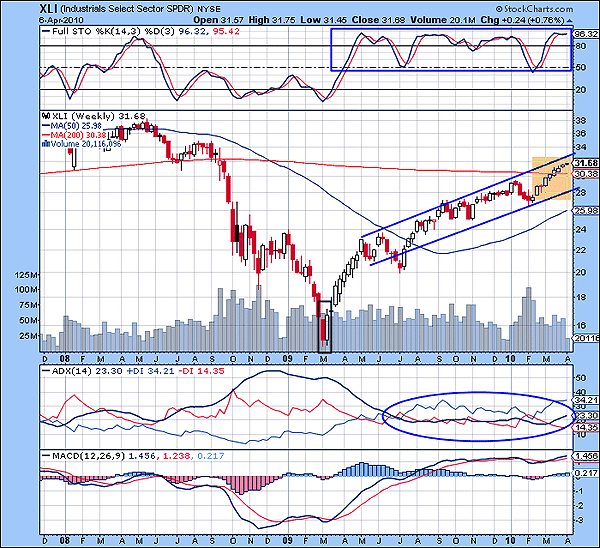
| The bullish journey for the Industrial Select Sector SPDR (XLI) began with a bullish reversal candlestick pattern -- a bullish engulfing in early March 2009. In Figure 1, the pattern is marked in the black block at the bottom of the chart. Gradually, XLI surged and violated all the resistance levels formed by the earlier correction. The sharp downtrend of 2008 had XLI plunge to 20 levels, and the average directional movement index (ADX) (14) steadily moved near the 20 levels with marginal increase in buying pressure. The entire pullback rally in Figure 1 was accompanied by a developing uptrend indicated by the ADX (14). Thus, XLI moved above the 200-day moving average (MA) and was likely to establish support there. |

|
| FIGURE 1: XLI, WEEKLY |
| Graphic provided by: StockCharts.com. |
| |
| But will the rally continue its upward path or will it get exhausted? Currently, XLI is moving within the ascending channel. The upper and lower trendlines of the channel were tested several times. The latest rally that was initiated from the lower trendline support was full of bullish strength. The size of the white candles reflects the strength in the rally; the big candles reflect robust strength, while the small shows weakness in the price action. In Figure 1, we can see the size of the bullish candles has gradually shrunk as XLI converted the 200-day MA resistance to support. The full stochastic (14,3,3) has been ranged in an overbought region of 50 and 80 levels. Therefore, the bullish momentum is likely to sustain. Figure 1 shows the oscillator at 96 levels, suggesting the possibility of a descending move toward the 50 levels. As a result, the price rally may retrace to the lower trendline support. |
| The moving average convergence/divergence (MACD) (12,26,9) is tangled with the trigger line in positive territory. The ADX (14) at 23 levels shows the developing uptrend. The long-term picture of XLI is bullish, but in the near term, the sector index is likely to descend to hit the lower trendline support. |

|
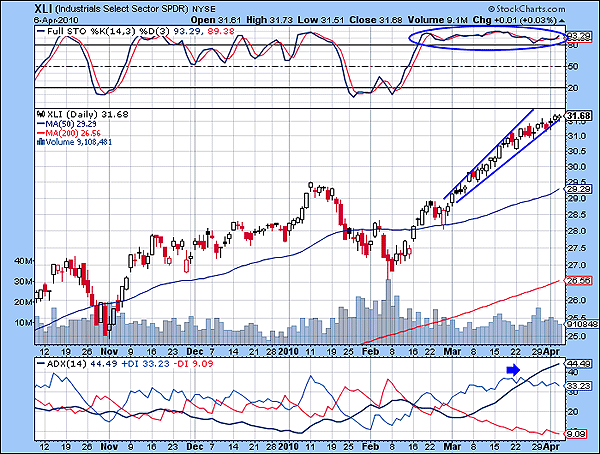
| FIGURE 2: XLI, DAILY |
| Graphic provided by: StockCharts.com. |
| |
| The daily time frame chart would confirm the short-term view for XLI. A rising wedge bearish reversal pattern has been formed in Figure 2. This reflects that the index is likely to drift down in the coming weeks. In addition, the stochastic oscillator is highly overbought from a month and half, and the ADX (14) has slipped above the 40 levels. This signifies the bearish reversal rally for XLI. Due to the highly bullish indicator, the sector may consolidate for a long period instead of undergoing downward price action. |
| To conclude, the 200-day MA on the weekly chart could act as strong support. However, due to current technical conditions, the index could witness minor turbulence in the near future. |
Active trader in the Indian stock markets since 2003 and a full-time writer. Trading is largely based upon technical analysis.
| Company: | Independent |
| Address: | C1/3 Parth Indraprasth Towers. Vastrapur |
| Ahmedabad, Guj 380015 | |
| E-mail address: | chaitalimohile@yahoo.co.in |
Traders' Resource Links | |
| Independent has not added any product or service information to TRADERS' RESOURCE. | |
Click here for more information about our publications!
Comments
Date: 04/07/10Rank: 3Comment:

Request Information From Our Sponsors
- StockCharts.com, Inc.
- Candle Patterns
- Candlestick Charting Explained
- Intermarket Technical Analysis
- John Murphy on Chart Analysis
- John Murphy's Chart Pattern Recognition
- John Murphy's Market Message
- MurphyExplainsMarketAnalysis-Intermarket Analysis
- MurphyExplainsMarketAnalysis-Visual Analysis
- StockCharts.com
- Technical Analysis of the Financial Markets
- The Visual Investor
- VectorVest, Inc.
- Executive Premier Workshop
- One-Day Options Course
- OptionsPro
- Retirement Income Workshop
- Sure-Fire Trading Systems (VectorVest, Inc.)
- Trading as a Business Workshop
- VectorVest 7 EOD
- VectorVest 7 RealTime/IntraDay
- VectorVest AutoTester
- VectorVest Educational Services
- VectorVest OnLine
- VectorVest Options Analyzer
- VectorVest ProGraphics v6.0
- VectorVest ProTrader 7
- VectorVest RealTime Derby Tool
- VectorVest Simulator
- VectorVest Variator
- VectorVest Watchdog
