HOT TOPICS LIST
- MACD
- Fibonacci
- RSI
- Gann
- ADXR
- Stochastics
- Volume
- Triangles
- Futures
- Cycles
- Volatility
- ZIGZAG
- MESA
- Retracement
- Aroon
INDICATORS LIST
LIST OF TOPICS
PRINT THIS ARTICLE
by Austin Passamonte
Looking at wedge formations near resistance levels can help confirm the next market trend.
Position: N/A
Austin Passamonte
Austin is a private trader who trades emini stock index futures intraday. He currently trades various futures markets from home in addition to managing a trader's educational forum
PRINT THIS ARTICLE
WEDGE FORMATIONS
Wasting Energy At Resistance
12/18/01 10:31:23 AMby Austin Passamonte
Looking at wedge formations near resistance levels can help confirm the next market trend.
Position: N/A
| Popular talk this week includes an obligatory "Santa Claus" rally where fund managers prop up large holding stocks to pin their performance records and possibly chase some hot issues higher. A triple-witch expiration week of equity, index options and futures often contribute to upside momentum as well. But what lies ahead of us into the vaunted "January Effect" where the last days of December and first sessions in January seasonally trend higher? |
| Here's what we see: |

|
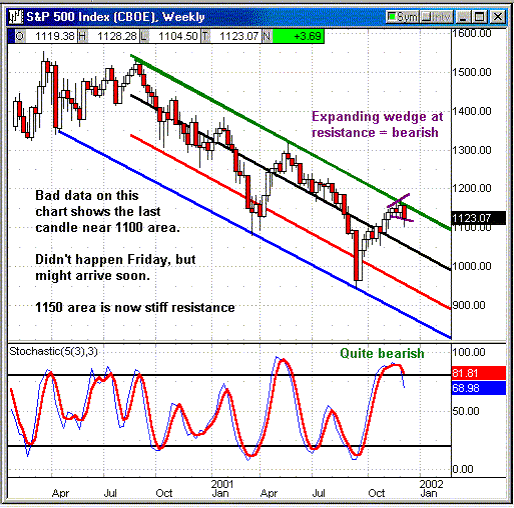
| Figure 1: Weekly Chart: SPX |
| Graphic provided by: Quote.com. |
| Graphic provided by: QCharts. |
| |
| The regression channel rejected price action up near resistance where a bearish expanding wedge is forming. Why is an expanding wedge bearish? Higher highs and lower lows are evidence of a market expending energy, not storing it. A coiled wedge right below resistance would indicate building pressure to pop above that overhead mesh and assault new recent highs from there. Stored energy in a price consolidation is what it takes for price action to conquer historical resistance, not expended energy as the pattern expands. Stochastic values are also just now turning down from oversold extreme for the very first time since May, 2001. What happened after that? Where was price action once these chart signals reached oversold extreme in relation to May? |
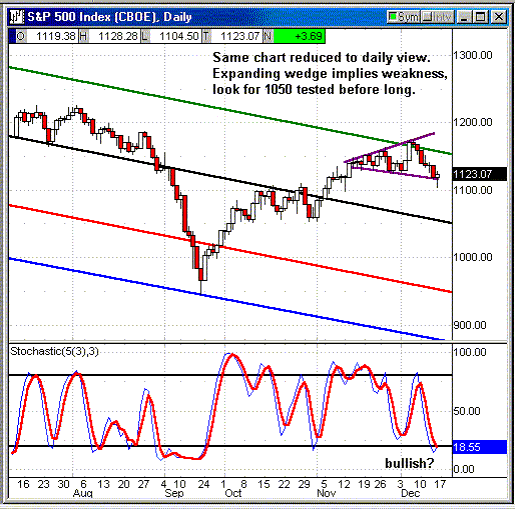
 Figure 2: Daily Chart: SPX The daily-chart picture paints a different tale. Take out Friday's faulty data and a perfect expanding wedge is visible here just below resistance. Odds are that overhead web holds firm on further retest ahead. Will there be a further retest or will price action merely fall off a cliff? Stochastic values turning bullish predict at least one more swing up into the range higher from here. |
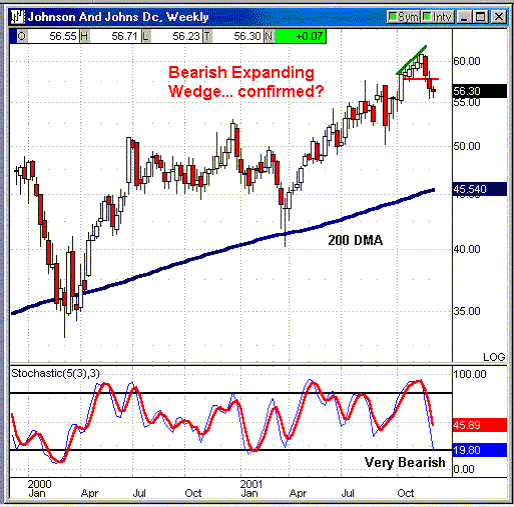
 Figure 3: Daily Chart: JNJ What caused the drag on broad markets last week? Techs, drugs and banking were all culprits and make up the three largest sectors of S&P 500 index as well. Scanning various charts in the SPX index reveals many that mirror or lead the broad market in weakening patterns. Here too we observe Johnson & Johnson meeting overhead resistance and forming an expanding wedge as well. Instead of consolidating energy that can be directed toward breaking resistance it is expending energy with higher highs and lower lows. Markets and stocks that consolidate price action coil stored energy for explosive moves either way. The same issues wasting energy near critical lines in the sand most often peter out and break down instead-- Important signs to watch for as fair warning to longs that may wish to hedge, or shorts who might smell opportunity instead! |
Austin is a private trader who trades emini stock index futures intraday. He currently trades various futures markets from home in addition to managing a trader's educational forum
| Title: | Individual Trader |
| Company: | CoiledMarkets.com |
| Address: | PO Box 633 |
| Naples, NY 14512 | |
| Website: | coiledmarkets.com/blog |
| E-mail address: | austinp44@yahoo.com |
Traders' Resource Links | |
| CoiledMarkets.com has not added any product or service information to TRADERS' RESOURCE. | |
Click here for more information about our publications!
Comments
Date: 12/18/01Rank: 5Comment:
Date: 12/19/01Rank: 4Comment:

Request Information From Our Sponsors
- StockCharts.com, Inc.
- Candle Patterns
- Candlestick Charting Explained
- Intermarket Technical Analysis
- John Murphy on Chart Analysis
- John Murphy's Chart Pattern Recognition
- John Murphy's Market Message
- MurphyExplainsMarketAnalysis-Intermarket Analysis
- MurphyExplainsMarketAnalysis-Visual Analysis
- StockCharts.com
- Technical Analysis of the Financial Markets
- The Visual Investor
- VectorVest, Inc.
- Executive Premier Workshop
- One-Day Options Course
- OptionsPro
- Retirement Income Workshop
- Sure-Fire Trading Systems (VectorVest, Inc.)
- Trading as a Business Workshop
- VectorVest 7 EOD
- VectorVest 7 RealTime/IntraDay
- VectorVest AutoTester
- VectorVest Educational Services
- VectorVest OnLine
- VectorVest Options Analyzer
- VectorVest ProGraphics v6.0
- VectorVest ProTrader 7
- VectorVest RealTime Derby Tool
- VectorVest Simulator
- VectorVest Variator
- VectorVest Watchdog
