HOT TOPICS LIST
- MACD
- Fibonacci
- RSI
- Gann
- ADXR
- Stochastics
- Volume
- Triangles
- Futures
- Cycles
- Volatility
- ZIGZAG
- MESA
- Retracement
- Aroon
INDICATORS LIST
LIST OF TOPICS
PRINT THIS ARTICLE
by Ranjan Jha, CMT
The US dollar has been in an uptrend this year. Bond and currency charts support the theory that it may go even higher.
Position: N/A
Ranjan Jha, CMT
I am a member of the Market Technicians Association and manage a limited partnership investment club in Virginia. Always seek advice from your own Financial Advisor before acting on any method outlined here since every circumstance is different.
PRINT THIS ARTICLE
CHART ANALYSIS
Intermarket Analysis With Dollar And Bonds
04/05/10 11:55:58 AMby Ranjan Jha, CMT
The US dollar has been in an uptrend this year. Bond and currency charts support the theory that it may go even higher.
Position: N/A
| Exchange traded funds (ETFs) bring currency, commodity, and bond trading opportunities to an average stock trader. They also provide tools to gain insight into interaction between different markets. The importance of intermarket analysis cannot be emphasized enough in our increasingly interlinked global markets. |
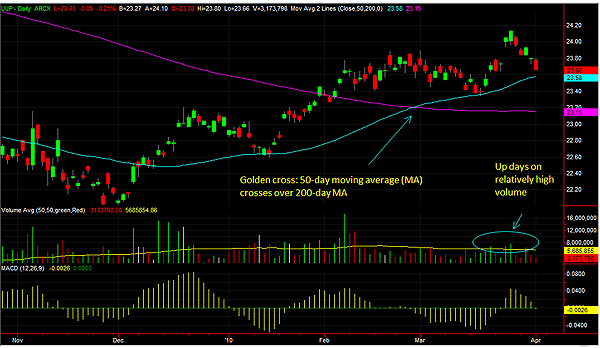
| Figure 1 shows the daily chart of UUP, which is the PowerShares DB US Dollar Index Bullish ETF. It tracks the price and yield performance, before fees and expenses, of the Deutschebank Long US Dollar Futures index. The US dollar has been showing remarkable strength this year. Its price has been bouncing above the 50-day moving average (MA). In late February 2010, we saw the golden cross when the 50-day MA line crossed above the 200-day MA line. In trend-following, it's considered quite bullish. In addition, in the last several sessions, UUP has climbed up on higher volume compared to down days. This continued strength is further highlighted by the fact that the Federal Reserve is keeping the short-term interest rate near zero and plans to keep it there for an extended period. |

|
| FIGURE 1: UUP ETF, DAILY. The US dollar bullish ETF is trending higher above both 50-day and 200-day moving averages. |
| Graphic provided by: TradeStation. |
| |
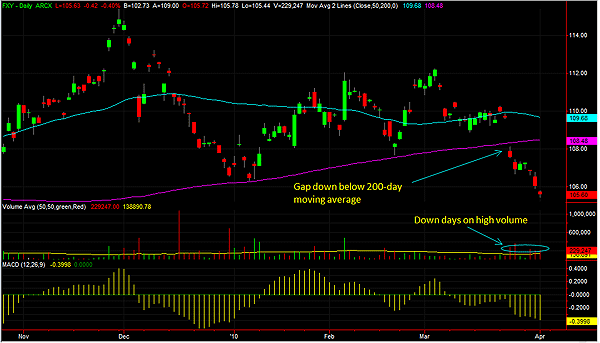
| But is the dollar done going higher? For that, let's look at another major currency, the yen. Figure 2 shows daily chart of the FXY (CurrencyShares Japanese Yen Trust). On March 24, it gapped below its 200-day MA, and since then, it has been going down on relatively higher volume. This heavy selling in the yen supports the dollar's case for further rise. |

|
| FIGURE 2: FXY ETF, DAILY. The yen trust ETF shows signs of accelerated selling. |
| Graphic provided by: TradeStation. |
| |
| At this point, we can dig through several factors supportive of this rally. There may be more sovereign defaults on the way, the Fed might increase rates sooner than it says, or the euro may not be as reliable as before, and hence the dollar is the only safe haven. On the other hand, there are several structural factors against the dollar. A persistently large national debt and increasing deficit should undermine its value. It is tough to judge which story will play out. However, a quick study of an intermarket interaction shows which way professionals are leaning. If they are creating a trend, then it's not prudent to stand in front of that freight train. |

|
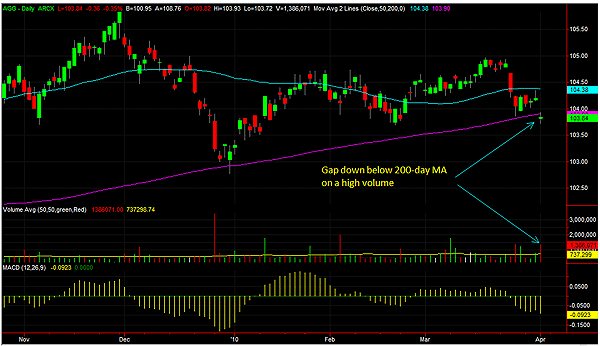
| FIGURE 3: AGG ETF, DAILY. If selling continues in the bond ETF, then higher interest rates are not far away. |
| Graphic provided by: TradeStation. |
| |
| Figure 3 is a daily chart of AGG (iShares Barclays Aggregate Bond). On April 1, it gapped below its 200-day MA on a high volume. If it continues on this path, then it will be clear that the bond market anticipates higher rates in the near future as bond prices are inversely correlated with its yield. For example, say you buy a bond for its face value of $100, yielding 5% or $5. If you happen to sell it for $95, then the person who bought it will still get $5 yield but the rate of return will now be $5/$95 or 5.26%. A higher rate will strengthen the dollar. If a country's interest rates are higher, then foreign investors will be more attracted to its interest-bearing assets. This will raise the demand for the currency and cause it to appreciate on foreign exchange markets. This is the picture that intermarket analysis is painting. As long as this pattern holds, the dollar is most likely going higher. |
I am a member of the Market Technicians Association and manage a limited partnership investment club in Virginia. Always seek advice from your own Financial Advisor before acting on any method outlined here since every circumstance is different.
| Address: | 2039 Stone Mill Drive |
| Salem, VA 24153 | |
| Phone # for sales: | 540-330-2911 |
| E-mail address: | ranjanjha@hotmail.com |
Click here for more information about our publications!
Comments
Date: 04/05/10Rank: 3Comment:
Date: 04/06/10Rank: 5Comment:

Request Information From Our Sponsors
- StockCharts.com, Inc.
- Candle Patterns
- Candlestick Charting Explained
- Intermarket Technical Analysis
- John Murphy on Chart Analysis
- John Murphy's Chart Pattern Recognition
- John Murphy's Market Message
- MurphyExplainsMarketAnalysis-Intermarket Analysis
- MurphyExplainsMarketAnalysis-Visual Analysis
- StockCharts.com
- Technical Analysis of the Financial Markets
- The Visual Investor
- VectorVest, Inc.
- Executive Premier Workshop
- One-Day Options Course
- OptionsPro
- Retirement Income Workshop
- Sure-Fire Trading Systems (VectorVest, Inc.)
- Trading as a Business Workshop
- VectorVest 7 EOD
- VectorVest 7 RealTime/IntraDay
- VectorVest AutoTester
- VectorVest Educational Services
- VectorVest OnLine
- VectorVest Options Analyzer
- VectorVest ProGraphics v6.0
- VectorVest ProTrader 7
- VectorVest RealTime Derby Tool
- VectorVest Simulator
- VectorVest Variator
- VectorVest Watchdog
