HOT TOPICS LIST
- MACD
- Fibonacci
- RSI
- Gann
- ADXR
- Stochastics
- Volume
- Triangles
- Futures
- Cycles
- Volatility
- ZIGZAG
- MESA
- Retracement
- Aroon
INDICATORS LIST
LIST OF TOPICS
PRINT THIS ARTICLE
by Koos van der Merwe
VMWare, Inc., is a provider of virtualization software. Is it a buy for your portfolio?
Position: Hold
Koos van der Merwe
Has been a technical analyst since 1969, and has worked as a futures and options trader with First Financial Futures in Johannesburg, South Africa.
PRINT THIS ARTICLE
GANN ANGLE
VMWare, That Virtualization Stock
04/01/10 09:18:33 AMby Koos van der Merwe
VMWare, Inc., is a provider of virtualization software. Is it a buy for your portfolio?
Position: Hold
| When we think of virtualization, we must look at a dictionary, which describes the word as "hypothetical," generated by a computer for reasons of economics, convenience, or performance. But then, of course, the term "cloud computer" may explain it better. Cloud computing is Internet-based computing, whereby shared resources, software, and information are provided to computers and other such devices on demand, like a public utility. I mention this because that is VMWare's (VMW) forte. It is something the technologically adept understand almost intuitively, but we, the investors, must decide whether the software they have developed will be broadly useful and/or be ahead of its competitors, and the only way we can do this effectively is to watch the movement of the share price and analyze all future movement efficiently. |

|
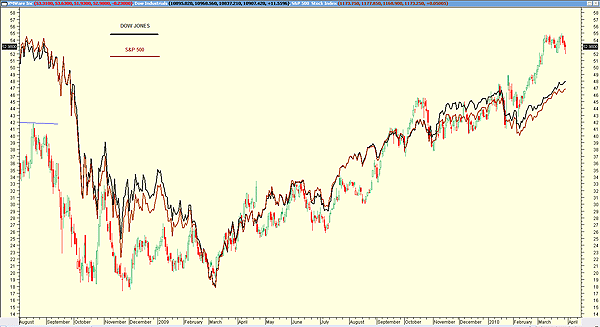
| FIGURE 1: VMW, MONTHLY. The movement of VMW here is compared to the DJIA and the S&P 500. |
| Graphic provided by: MetaStock. |
| |
| Figure 1 compares the movement of the stock with the movement of the Dow Jones Industrial Average (DJIA) and the Standard & Poor's 500. We can see that the share price has moved with the indexes, but that at the moment, with the indexes rising, VMW has been moving sideways, forming what could be a flag formation. |

|
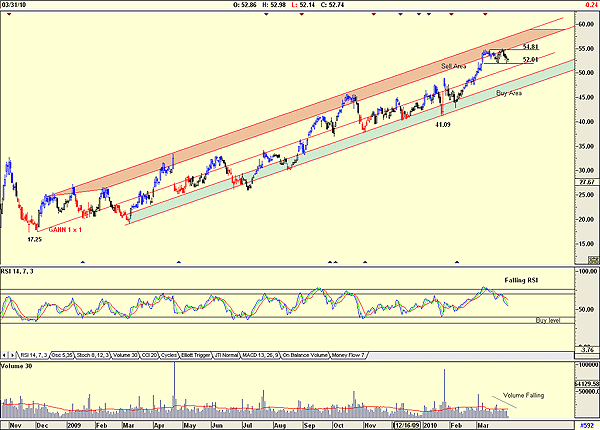
| FIGURE 2: VMW, DAILY. The movement of VMW is showing the Gann buy and sell zones. |
| Graphic provided by: AdvancedGET. |
| |
| Figure 2 is a daily chart showing the flag formation that is developing. This pattern suggests that should the price break above $54.81, then the target could be $91.37 (54.81 - 17.25 = 37.56 + 54 81 = 91.37). The charts also show support at the $52.01 level. With volume falling whenever the price fell, a sign of strength, the chances that the price could rise to retest the $54.81 level is more than likely. The relative strength index (RSI), however, is still falling, suggesting that the sideways movement could be a long one. Do note the buy and sell areas on the chart. These are areas prepared by drawing parallel lines to a Gann 1x1 angle. It shows that VMW is moving out of the sell area moving toward a buy area, which could take some time to achieve. So when we are looking at the charts, VMW appears to be anticipating movement in the DJIA and S&P 500, looking for a correction in the near future. However, the correction does not appear to be major, and any move toward the $50 level, the Gann buy area, presents a buying opportunity. |
Has been a technical analyst since 1969, and has worked as a futures and options trader with First Financial Futures in Johannesburg, South Africa.
| Address: | 3256 West 24th Ave |
| Vancouver, BC | |
| Phone # for sales: | 6042634214 |
| E-mail address: | petroosp@gmail.com |
Click here for more information about our publications!
PRINT THIS ARTICLE

Request Information From Our Sponsors
- StockCharts.com, Inc.
- Candle Patterns
- Candlestick Charting Explained
- Intermarket Technical Analysis
- John Murphy on Chart Analysis
- John Murphy's Chart Pattern Recognition
- John Murphy's Market Message
- MurphyExplainsMarketAnalysis-Intermarket Analysis
- MurphyExplainsMarketAnalysis-Visual Analysis
- StockCharts.com
- Technical Analysis of the Financial Markets
- The Visual Investor
- VectorVest, Inc.
- Executive Premier Workshop
- One-Day Options Course
- OptionsPro
- Retirement Income Workshop
- Sure-Fire Trading Systems (VectorVest, Inc.)
- Trading as a Business Workshop
- VectorVest 7 EOD
- VectorVest 7 RealTime/IntraDay
- VectorVest AutoTester
- VectorVest Educational Services
- VectorVest OnLine
- VectorVest Options Analyzer
- VectorVest ProGraphics v6.0
- VectorVest ProTrader 7
- VectorVest RealTime Derby Tool
- VectorVest Simulator
- VectorVest Variator
- VectorVest Watchdog
