HOT TOPICS LIST
- MACD
- Fibonacci
- RSI
- Gann
- ADXR
- Stochastics
- Volume
- Triangles
- Futures
- Cycles
- Volatility
- ZIGZAG
- MESA
- Retracement
- Aroon
INDICATORS LIST
LIST OF TOPICS
PRINT THIS ARTICLE
by Chaitali Mohile
A long-term bullish reversal pattern has appeared on the monthly time frame.
Position: Buy
Chaitali Mohile
Active trader in the Indian stock markets since 2003 and a full-time writer. Trading is largely based upon technical analysis.
PRINT THIS ARTICLE
HEAD & SHOULDERS
Computer Technology Index At Breakout Point?
03/30/10 12:10:22 PMby Chaitali Mohile
A long-term bullish reversal pattern has appeared on the monthly time frame.
Position: Buy
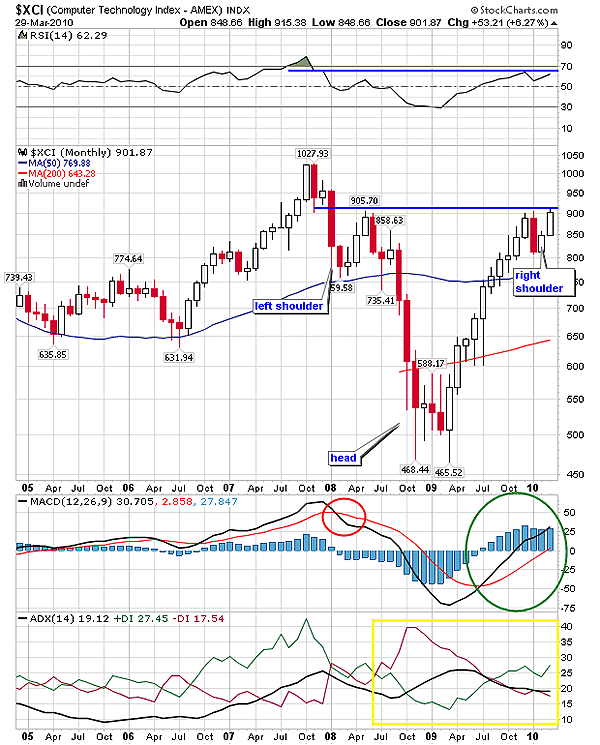
| The formation of an inverted head & shoulders pattern on the monthly time frame is a long-term bullish indication for any stock/index. The Computer Technology Index ($XCI) had a robust resistance at 900 levels. In 2008, $XCI plunged below 900 and established support at the 50-day moving average (MA). The index reversed from this support, challenging the fresh resistance at 900 levels. However, strong bearish momentum pulled down the index. Thereafter, $XCI entered a fresh medium-term downtrend, losing almost 50% of the its value. The bearish rally stabilized in late 2008 and early 2009. Thus, a fresh upward move was initiated due to an overheated downtrend in Figure 1. Within a year, the index recovered from the past losses by hitting the previous resistance at 900 levels. Later, the index remained range-bound between 800 and 900 levels, and thus, the head & shoulders pattern was formed in a year and a half. Figure 1 is the monthly chart, and so, the pattern that appeared is a long-term one. |

|
| FIGURE 1: $XCI, MONTHLY |
| Graphic provided by: StockCharts.com. |
| |
| The inverted head & shoulder is a bullish reversal formation with the potential breakout in an upward direction. The long-term pattern gives a higher target with an equally long-term perspective, suitable for positional traders and investors. The average directional movement index (ADX) (14) is marginally below 20 levels, but the buying pressure is indicated by the positive directional index (+DI); the green line has climbed upward, suggesting the possibility of a developing uptrend in the near future. The negative moving average convergence/divergence (MACD) (12,26,9) (see the red circle) in Figure 1 has turned bullish in mid-2009 and remained positive throughout the bullish rally. Thus, the strong momentum is likely to sustain during the bullish breakout of $XCI. The relative strength index (RSI) (14) has also formed the inverted head & shoulders pattern, reflecting bullish strength in the rally. |
| Hence, the long-term head & shoulders pattern would break upward and open fresh trading opportunities for traders. The potential levels after the breakout is measured by adding the length of the head to the neckline level (breakout level); 900 - 468 = 432 + 900 = 1332 is the long-term target for $XCI. However, the target would not be achieved in one single rally. After the breakout, the index is likely to hit an immediate resistance at 1027 levels. |

|
| FIGURE 2: $XCI, DAILY |
| Graphic provided by: StockCharts.com. |
| |
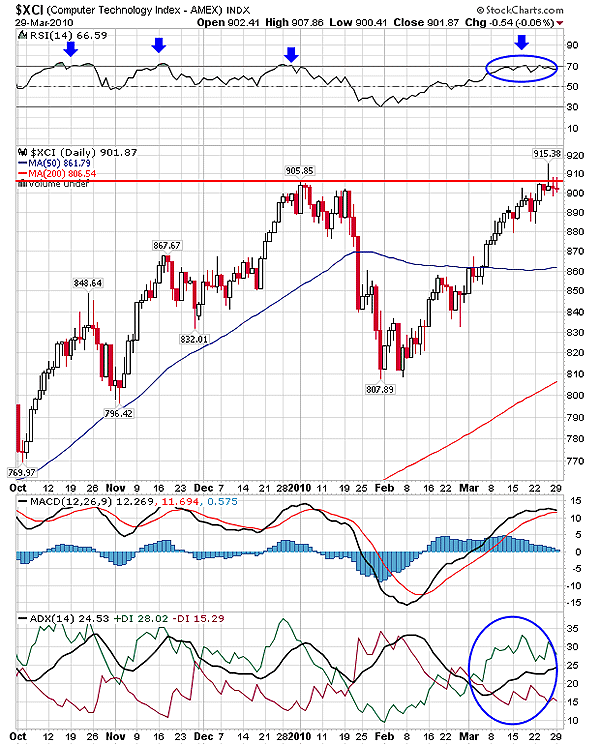
| The monthly charts are not for small or short-term traders. So a glance on the daily chart is essential (Figure 2). After looking at the chart, the question that hit my mind is: Is the index forming a small-term inverted head & shoulders pattern? The left shoulder and the head has already been constructed, but the right shoulder is yet to be formed. The shooting star that formed an intraday high of 915 is followed by the two bearish doji, suggesting a small bearish rally. The RSI (14) in Figure 2 is reluctant to violate the historical resistance at 70 levels. The arrows marked shows that the RSI (14) was unable to surge in the highly overbought levels above 70. The positive MACD (12,.26,9) has moved closer to the trigger line (red line) and might form a bearish crossover. But the ADX (14) shows the developing uptrend. Thus, $XCI is likely to retrace toward the support at 880 and rush back to the resistance (neckline) at 905 levels. This would form the inverted head & shoulders in Figure 2 as well. Traders are requested to stay watchful during the formation. |
| The indicators are not suggesting a dramatic decline on the chart. In the current bullish scenario, $XCI may breach the resistance at 905 without forming the right shoulder. Thus, any breakout above 905 levels would be the best short-term buying opportunity. |
Active trader in the Indian stock markets since 2003 and a full-time writer. Trading is largely based upon technical analysis.
| Company: | Independent |
| Address: | C1/3 Parth Indraprasth Towers. Vastrapur |
| Ahmedabad, Guj 380015 | |
| E-mail address: | chaitalimohile@yahoo.co.in |
Traders' Resource Links | |
| Independent has not added any product or service information to TRADERS' RESOURCE. | |
Click here for more information about our publications!
Comments
Date: 03/30/10Rank: 1Comment:

Request Information From Our Sponsors
- StockCharts.com, Inc.
- Candle Patterns
- Candlestick Charting Explained
- Intermarket Technical Analysis
- John Murphy on Chart Analysis
- John Murphy's Chart Pattern Recognition
- John Murphy's Market Message
- MurphyExplainsMarketAnalysis-Intermarket Analysis
- MurphyExplainsMarketAnalysis-Visual Analysis
- StockCharts.com
- Technical Analysis of the Financial Markets
- The Visual Investor
- VectorVest, Inc.
- Executive Premier Workshop
- One-Day Options Course
- OptionsPro
- Retirement Income Workshop
- Sure-Fire Trading Systems (VectorVest, Inc.)
- Trading as a Business Workshop
- VectorVest 7 EOD
- VectorVest 7 RealTime/IntraDay
- VectorVest AutoTester
- VectorVest Educational Services
- VectorVest OnLine
- VectorVest Options Analyzer
- VectorVest ProGraphics v6.0
- VectorVest ProTrader 7
- VectorVest RealTime Derby Tool
- VectorVest Simulator
- VectorVest Variator
- VectorVest Watchdog
