HOT TOPICS LIST
- MACD
- Fibonacci
- RSI
- Gann
- ADXR
- Stochastics
- Volume
- Triangles
- Futures
- Cycles
- Volatility
- ZIGZAG
- MESA
- Retracement
- Aroon
INDICATORS LIST
LIST OF TOPICS
PRINT THIS ARTICLE
by James Kupfer
Fibonacci lines are normally used to project support and resistance zones for retracement moves, but as we can see on the DJIA, they may also prove useful for identifying resistance levels for trending markets.
Position: Sell
James Kupfer
Mr. Kupfer is a market professional and amateur stock market commentator. Disclosure: It is likely that Mr. Kupfer has or will enter a position in any security he writes about.
PRINT THIS ARTICLE
FIBONACCI
Resistance Levels In Trending Markets
03/30/10 08:21:16 AMby James Kupfer
Fibonacci lines are normally used to project support and resistance zones for retracement moves, but as we can see on the DJIA, they may also prove useful for identifying resistance levels for trending markets.
Position: Sell
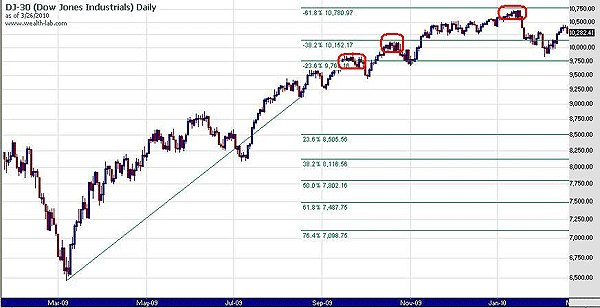
| The bull market move that began in March 2009 is now just over a year old. And despite what you might read and hear in the popular news media, the bear market that began in March 2000 is likely just now ready to resume. As such, a prudent course of action is to watch for a possible market reversal and be prepared should the market decide it is in a bearish mood. See Figure 1. |

|
| FIGURE 1: DJIA, DAILY |
| Graphic provided by: WealthLab. |
| |
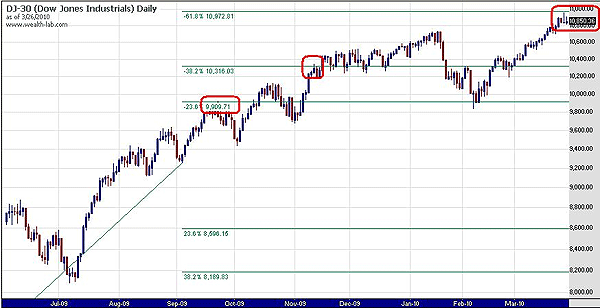
| As promised, we will attempt to identify potential reversal points and resistance zones using Fibonacci lines. Let's start with Figure 2, shown using a Fibonacci retracement from the critical March 2009 low to a recent trough low (chart is zoomed in and does not show the most recent market prices). Instead of looking for support zones, we instead find Fibonacci levels above the trough to identify potential resistance zones. Indeed, each of the price levels in red is forecasted by these Fibonacci lines. |

|
| FIGURE 2: DJIA, DAILY |
| Graphic provided by: WealthLab. |
| |
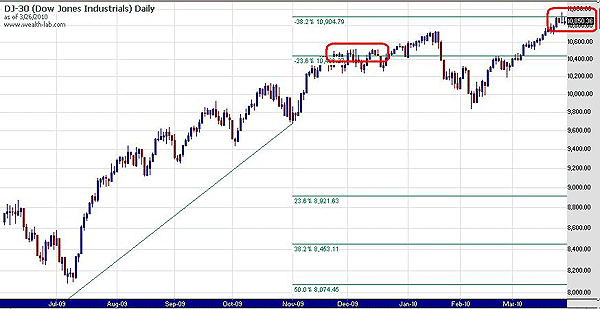
| Now let's move to the next trough low as zoomed in Figure 3. Again, the Fibonacci lines accurately identify for the most part areas where prices experienced resistance. Note that the last area circled in red is where prices are today. See the steady progression on Fibonacci lines accurately forecasting resistance levels. |

|
| FIGURE 3: DJIA, DAILY |
| Graphic provided by: WealthLab. |
| |

|
| FIGURE 4: DJIA, DAILY |
| Graphic provided by: WealthLab. |
| |
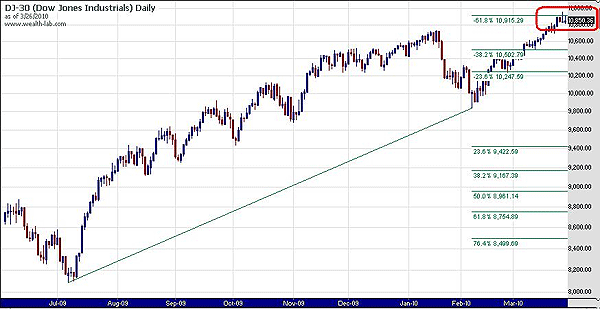
| Finally, let us end with a shot of the major July 2009 trough to the major February 2010 trough (Figure 4). Again, Fibonacci levels forecast a resistance zone right where prices are currently. Of the last three charts where prices are still below the maximum Fibonacci level I have chosen to show, all three show a resistance zone where prices are today. This is a warning worth paying attention to. |
Mr. Kupfer is a market professional and amateur stock market commentator. Disclosure: It is likely that Mr. Kupfer has or will enter a position in any security he writes about.
Click here for more information about our publications!
Comments
Date: 03/30/10Rank: 5Comment:
Date: 03/30/10Rank: 4Comment: Thanks for the article. I agree with your conclusion, although I derived it differently -- I projected the Fib Wave 4 extension (Robert Miner s book describes this).
My only suggestion is that you make your charts bigger -- the print is too small and fuzzy to read.
Again, thanks for the article.
--Matt
Date: 03/30/10Rank: 3Comment:

Request Information From Our Sponsors
- StockCharts.com, Inc.
- Candle Patterns
- Candlestick Charting Explained
- Intermarket Technical Analysis
- John Murphy on Chart Analysis
- John Murphy's Chart Pattern Recognition
- John Murphy's Market Message
- MurphyExplainsMarketAnalysis-Intermarket Analysis
- MurphyExplainsMarketAnalysis-Visual Analysis
- StockCharts.com
- Technical Analysis of the Financial Markets
- The Visual Investor
- VectorVest, Inc.
- Executive Premier Workshop
- One-Day Options Course
- OptionsPro
- Retirement Income Workshop
- Sure-Fire Trading Systems (VectorVest, Inc.)
- Trading as a Business Workshop
- VectorVest 7 EOD
- VectorVest 7 RealTime/IntraDay
- VectorVest AutoTester
- VectorVest Educational Services
- VectorVest OnLine
- VectorVest Options Analyzer
- VectorVest ProGraphics v6.0
- VectorVest ProTrader 7
- VectorVest RealTime Derby Tool
- VectorVest Simulator
- VectorVest Variator
- VectorVest Watchdog
