HOT TOPICS LIST
- MACD
- Fibonacci
- RSI
- Gann
- ADXR
- Stochastics
- Volume
- Triangles
- Futures
- Cycles
- Volatility
- ZIGZAG
- MESA
- Retracement
- Aroon
INDICATORS LIST
LIST OF TOPICS
PRINT THIS ARTICLE
by David Penn
A double bottom plus an ascending triangle may equal a 170% rally from the September 17th lows.
Position: N/A
David Penn
Technical Writer for Technical Analysis of STOCKS & COMMODITIES magazine, Working-Money.com, and Traders.com Advantage.
PRINT THIS ARTICLE
ASCENDING TRIANGLES
Amazon's Ascending Triangle
12/13/01 03:22:19 PMby David Penn
A double bottom plus an ascending triangle may equal a 170% rally from the September 17th lows.
Position: N/A
| Of late I have been looking at combinations of chart patterns as a way of confirming the start of both up- and downtrends. For those who feel more confident with chart patterns than indicators and oscillators, finding combinations of chart patterns can go a long way toward both determining when real bottoms and tops have been reached, as well as discovering the likely direction of breakouts or breakdowns from secondary and tertiary chart patterns in a new trend. |
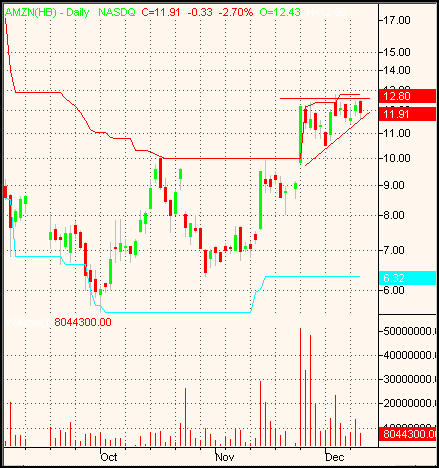
| The previous example was the combination of a bearish flag and a bearish rising wedge during a downtrend in shares of Eastman Kodak (EK). The current example looks at another popular stock, Amazon.com (AMZN), and its attempt to rally from all-time lows of about 5.5. The first chart pattern of note in Amazon.com is the double bottom that begins in mid-August with a drop below 10, troughs during the September correction at 5.5 and rallies back to 10 by mid-October. This creates the first half of the formation. The second half of the formation begins with a correction from mid-October to early November, a correction that took AMZN to a low of about 6.5. AMZN rallied in mid-November, reaching 10 again and started to correct at the end of the month. However, a sizeable number of buyers stepped in near the end of the month to jack up AMZN 11% back above 10. |

|
| This bullish ascending triangle suggests further advances should prices break out on the upside. |
| Graphic provided by: TradeStation. |
| |
| Given this double bottom alone, AMZN could be expected to reach a high of about 14.5. It is not a perfect double bottom: the second trough in late October is farther away--some 15%--from the first trough in September, and the failure of prices to break through cleanly at the end of November likely would have discouraged many Amazon bulls. But the breakout on November 26th is bullish in the extreme, and more than enough to forgive the late November pullback. |
| More heartening news for Amazon bulls comes in the form of the ascending triangle that developed immediately after the breakout. In fact, the big volume day forms the beginning of both the upwardly sloping lower trendline at the base of the ascending triangle as well as marking the top of the triangle at about 12.5. Unlike the double bottom, the ascending triangle is virtually pristine: there are at least four touches against the upwardly sloping lower trendline and at least three touches at the top horizontal resistance line. There is some intraday activity above the resistance point that occurs about midway through the formation; I take some consolation from the fact that the actual close on that day is exactly at the resistance line. |
| Should this ascending triangle break out on the upside, thus continuing Amazon's bullish advance since mid-September (an advance that has seen Amazon tack on some 127% already), shares of Amazon could find themselves in the 15 to 17 range, which would have them revisiting old highs from the summer of 2001. |
Technical Writer for Technical Analysis of STOCKS & COMMODITIES magazine, Working-Money.com, and Traders.com Advantage.
| Title: | Technical Writer |
| Company: | Technical Analysis, Inc. |
| Address: | 4757 California Avenue SW |
| Seattle, WA 98116 | |
| Phone # for sales: | 206 938 0570 |
| Fax: | 206 938 1307 |
| Website: | www.Traders.com |
| E-mail address: | DPenn@traders.com |
Traders' Resource Links | |
| Charting the Stock Market: The Wyckoff Method -- Books | |
| Working-Money.com -- Online Trading Services | |
| Traders.com Advantage -- Online Trading Services | |
| Technical Analysis of Stocks & Commodities -- Publications and Newsletters | |
| Working Money, at Working-Money.com -- Publications and Newsletters | |
| Traders.com Advantage -- Publications and Newsletters | |
| Professional Traders Starter Kit -- Software | |
Click here for more information about our publications!
Comments
Date: 12/18/01Rank: 3Comment:

Request Information From Our Sponsors
- StockCharts.com, Inc.
- Candle Patterns
- Candlestick Charting Explained
- Intermarket Technical Analysis
- John Murphy on Chart Analysis
- John Murphy's Chart Pattern Recognition
- John Murphy's Market Message
- MurphyExplainsMarketAnalysis-Intermarket Analysis
- MurphyExplainsMarketAnalysis-Visual Analysis
- StockCharts.com
- Technical Analysis of the Financial Markets
- The Visual Investor
- VectorVest, Inc.
- Executive Premier Workshop
- One-Day Options Course
- OptionsPro
- Retirement Income Workshop
- Sure-Fire Trading Systems (VectorVest, Inc.)
- Trading as a Business Workshop
- VectorVest 7 EOD
- VectorVest 7 RealTime/IntraDay
- VectorVest AutoTester
- VectorVest Educational Services
- VectorVest OnLine
- VectorVest Options Analyzer
- VectorVest ProGraphics v6.0
- VectorVest ProTrader 7
- VectorVest RealTime Derby Tool
- VectorVest Simulator
- VectorVest Variator
- VectorVest Watchdog
