HOT TOPICS LIST
- MACD
- Fibonacci
- RSI
- Gann
- ADXR
- Stochastics
- Volume
- Triangles
- Futures
- Cycles
- Volatility
- ZIGZAG
- MESA
- Retracement
- Aroon
INDICATORS LIST
LIST OF TOPICS
PRINT THIS ARTICLE
by Donald W. Pendergast, Jr.
Of all the stocks in the S&P 500, Zions Bancorp has the highest 13-week relative strength ranking versus this key large-cap index. But even the strongest stocks will eventually pull back to key support, as appears to be the case with ZION.
Position: Sell
Donald W. Pendergast, Jr.
Donald W. Pendergast is a financial markets consultant who offers specialized services to stock brokers and high net worth individuals who seek a better bottom line for their portfolios.
PRINT THIS ARTICLE
REVERSAL
High-Flying ZION Prepares For Pullback
03/26/10 12:12:15 PMby Donald W. Pendergast, Jr.
Of all the stocks in the S&P 500, Zions Bancorp has the highest 13-week relative strength ranking versus this key large-cap index. But even the strongest stocks will eventually pull back to key support, as appears to be the case with ZION.
Position: Sell
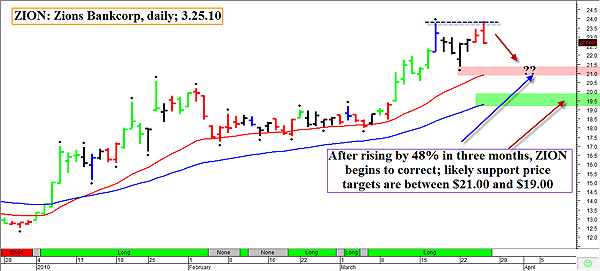
| Shares of Zions Bankcorp (ZION) enjoyed a nearly 50% rise since late December 2009 but now are manifesting signs of staging a possible reversal back toward key support levels. A brief look at ZION's daily chart follows (Figure 1). |

|
| FIGURE 1: ZION, DAILY. Stocks go up and stocks go down. After a nearly 50% run higher in three months, ZION appears ready to retrace at least a modest portion of its recent gains. |
| Graphic provided by: MetaStock. |
| Graphic provided by: Profitunity expert advisor from MetaStock v.11. |
| |
| Little wonder that ZION was at the top of the 13-week (a calendar quarter) relative strength list versus the S&P 500. The stock ran from $12.51 on December 30, 2009, all the way up to $23.85 on March 25, 2010. That's a nice capital gain by any standard, and apparently some investors and traders have decided to unload some of their ZION shares at an accelerated rate, given the sharp intraday reversal bar that just printed on the hard right edge of the chart. With an eerily similar pattern forming on all of the major US stock indexes (powerful intraday reversals on March 25, 2010, with evidence that major distribution is getting under way), it is very likely that ZION will also be dragged lower as the selling picks up over the next few sessions. In many cases, the 21-day exponential moving average (red line on chart) (EMA) will act as interim support; if a market is still destined to run higher, that particular EMA may serve as a springboard, with the stock bouncing higher after touching it. However, if a more substantial correction is due, once the 21-day EMA gives way, it is very common to see a quick continuation move down to the 50-day ema (blue line on chart). Should this reliable technical dynamic prove out in ZION's case, we can expect to see support manifest at various points between $19 and $21. |
| Playing ZION here could take several forms: * Buying an at-the-money put, hoping for a fast thrust down to those aforementioned support levels. * Selling an out-of-the-money call, in anticipation of the same move lower. * Waiting for an intraday (15- to 30-minute chart) pullback to support and then shorting shares of ZION, especially on pullbacks after the first break below $22.60 (Thursday's low). Any one of these short strategies could be a smart way to play the anticipated move down toward $19–21 in ZION. Just be sure to use modest trade sizing and account risk control however you decide to do it. |
Donald W. Pendergast is a financial markets consultant who offers specialized services to stock brokers and high net worth individuals who seek a better bottom line for their portfolios.
| Title: | Writer, market consultant |
| Company: | Linear Trading Systems LLC |
| Jacksonville, FL 32217 | |
| Phone # for sales: | 904-239-9564 |
| E-mail address: | lineartradingsys@gmail.com |
Traders' Resource Links | |
| Linear Trading Systems LLC has not added any product or service information to TRADERS' RESOURCE. | |
Click here for more information about our publications!
Comments
Date: 03/26/10Rank: 5Comment:

Request Information From Our Sponsors
- VectorVest, Inc.
- Executive Premier Workshop
- One-Day Options Course
- OptionsPro
- Retirement Income Workshop
- Sure-Fire Trading Systems (VectorVest, Inc.)
- Trading as a Business Workshop
- VectorVest 7 EOD
- VectorVest 7 RealTime/IntraDay
- VectorVest AutoTester
- VectorVest Educational Services
- VectorVest OnLine
- VectorVest Options Analyzer
- VectorVest ProGraphics v6.0
- VectorVest ProTrader 7
- VectorVest RealTime Derby Tool
- VectorVest Simulator
- VectorVest Variator
- VectorVest Watchdog
- StockCharts.com, Inc.
- Candle Patterns
- Candlestick Charting Explained
- Intermarket Technical Analysis
- John Murphy on Chart Analysis
- John Murphy's Chart Pattern Recognition
- John Murphy's Market Message
- MurphyExplainsMarketAnalysis-Intermarket Analysis
- MurphyExplainsMarketAnalysis-Visual Analysis
- StockCharts.com
- Technical Analysis of the Financial Markets
- The Visual Investor
