HOT TOPICS LIST
- MACD
- Fibonacci
- RSI
- Gann
- ADXR
- Stochastics
- Volume
- Triangles
- Futures
- Cycles
- Volatility
- ZIGZAG
- MESA
- Retracement
- Aroon
INDICATORS LIST
LIST OF TOPICS
PRINT THIS ARTICLE
by Donald W. Pendergast, Jr.
The Rahul Mohindar trading system has flashed new swing trade signals -- long for the US Dollar Index and short for the Canadian dollar.
Position: N/A
Donald W. Pendergast, Jr.
Donald W. Pendergast is a financial markets consultant who offers specialized services to stock brokers and high net worth individuals who seek a better bottom line for their portfolios.
PRINT THIS ARTICLE
TRADING SYSTEMS
RMO New Buys And Sells In Currencies
03/26/10 11:45:56 AMby Donald W. Pendergast, Jr.
The Rahul Mohindar trading system has flashed new swing trade signals -- long for the US Dollar Index and short for the Canadian dollar.
Position: N/A
| Those who own or lease MetaStock are probably already familiar with the Rahul Mohindar oscillator (RMO) trading system that comes standard with the previous two versions of the program. It's a unique blend of a trend-following and swing trading system, one that identifies the start of powerful market moves in stocks, currencies, and futures contracts in every time frame. While a review of the system isn't possible here, for now we'll settle for analyzing the daily charts of the US Dollar index (DX) and the Canadian dollar (CAD) continuous contracts, both of which are in RMO swing signal alerts. We'll start with the chart of the DX first (Figure 1). |

|
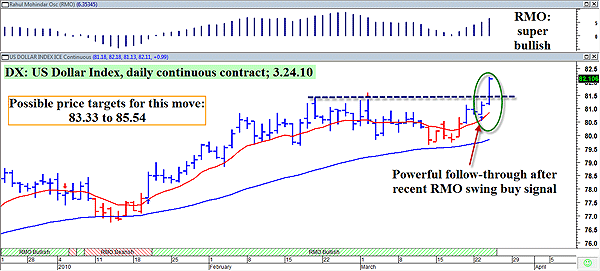
| FIGURE 1: DX, DAILY. With the US Dollar Index having cleared the June 2009 swing high at $81.79, the stage has been set for a possible run toward $84 to $85. |
| Graphic provided by: MetaStock. |
| Graphic provided by: Rahul Mohindar (RMO) tools from MetaStock v.11. |
| |
| Today's super-wide bullish breakout bar in the DX certainly seems to confirm the validity of the previous session's RMO swing buy signal (blue arrow within the green oval on the chart), as the DX finally broke out of its recent consolidation pattern. Today's breakout cleared the June 2009 swing high price of $81.79, possibly setting the stage for a runup toward the twin May 2009 swing highs residing at $83.33 and $85.54. Look for a possible pullback toward the breakout line, followed by continued upward momentum. Today's breakdown in the daily euro chart (the euro making up the largest single currency component in the US Dollar index) also appears to bode well for the DX as it attempts to reach the $84–85 area on this particular upthrust. |

|
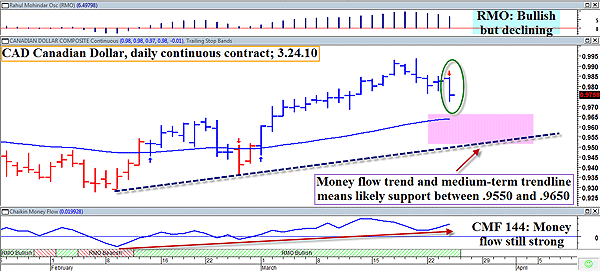
| FIGURE 2: CAD, DAILY. Despite the fresh sell signal, long-term money flow trends and intermediate-term support levels may act as a counterbalancing force to this current downthrust. |
| Graphic provided by: MetaStock. |
| Graphic provided by: Rahul Mohindar tools from MetaStock v.11. |
| |
| The technical state of the Canadian dollar chart (Figure 2), although modestly bearish, isn't quite as convincing as the US Dollar index. For one thing, the fresh RMO sell signal occurs as the RMO oscillator (top of chart) is still in the bullish zone. In addition, the 50-day exponential moving average (EMA) and a strong intermediate-term uptrend line look to be fairly formidable support zones, should the CAD continue to drop. The long-term Chaikin money flow (CMF)(144) is also in a pronounced uptrend, so don't look for a major crash in the loonie on this particular downdraft. It could happen here, but the technicals don't favor such a probability right now. Look for solid support to kick in between 0.9550 and 0.9650 in the CAD. |
| Of the two RMO swing trade signals presented here, the buy signal on the US Dollar Index looks like the real McCoy, while the sell signal on the Canadian dollar appears to be a possible fakeout. Watch both charts in the days to come to see how all of this plays out in the currency and the precious metals markets, as silver has also just flashed its own RMO sell signal. |
Donald W. Pendergast is a financial markets consultant who offers specialized services to stock brokers and high net worth individuals who seek a better bottom line for their portfolios.
| Title: | Writer, market consultant |
| Company: | Linear Trading Systems LLC |
| Jacksonville, FL 32217 | |
| Phone # for sales: | 904-239-9564 |
| E-mail address: | lineartradingsys@gmail.com |
Traders' Resource Links | |
| Linear Trading Systems LLC has not added any product or service information to TRADERS' RESOURCE. | |
Click here for more information about our publications!
Comments
Date: 03/26/10Rank: 5Comment:

Request Information From Our Sponsors
- StockCharts.com, Inc.
- Candle Patterns
- Candlestick Charting Explained
- Intermarket Technical Analysis
- John Murphy on Chart Analysis
- John Murphy's Chart Pattern Recognition
- John Murphy's Market Message
- MurphyExplainsMarketAnalysis-Intermarket Analysis
- MurphyExplainsMarketAnalysis-Visual Analysis
- StockCharts.com
- Technical Analysis of the Financial Markets
- The Visual Investor
- VectorVest, Inc.
- Executive Premier Workshop
- One-Day Options Course
- OptionsPro
- Retirement Income Workshop
- Sure-Fire Trading Systems (VectorVest, Inc.)
- Trading as a Business Workshop
- VectorVest 7 EOD
- VectorVest 7 RealTime/IntraDay
- VectorVest AutoTester
- VectorVest Educational Services
- VectorVest OnLine
- VectorVest Options Analyzer
- VectorVest ProGraphics v6.0
- VectorVest ProTrader 7
- VectorVest RealTime Derby Tool
- VectorVest Simulator
- VectorVest Variator
- VectorVest Watchdog
