HOT TOPICS LIST
- MACD
- Fibonacci
- RSI
- Gann
- ADXR
- Stochastics
- Volume
- Triangles
- Futures
- Cycles
- Volatility
- ZIGZAG
- MESA
- Retracement
- Aroon
INDICATORS LIST
LIST OF TOPICS
PRINT THIS ARTICLE
by Koos van der Merwe
Citigroup has been receiving a great deal of publicity recently. Is it time?
Position: Accumulate
Koos van der Merwe
Has been a technical analyst since 1969, and has worked as a futures and options trader with First Financial Futures in Johannesburg, South Africa.
PRINT THIS ARTICLE
OSCILLATORS
Is It Time To Buy Citigroup?
03/25/10 08:28:44 AMby Koos van der Merwe
Citigroup has been receiving a great deal of publicity recently. Is it time?
Position: Accumulate
| Vikram S. Pandit, chief executive of Citigroup, said recently that he believed the house of Citigroup was finally in order. For the last two years, he has tried, with mixed success, to clean up the financial mess. His task? After losses of billions of dollars, he has to deliver profits in 2010 or risk losing his job. We all know the story of Citigroup, in that it suffered more than most of the large banks from the financial crises because management was lax, most of their losses stemming from bad loans and investments. His job is not an easy one nor a popular one, but the feeling in the market is that he is succeeding in putting the company on the right tracks. What do the charts say? |

|
| FIGURE 1: CITIGROUP, WEEKLY |
| Graphic provided by: AdvancedGET. |
| |
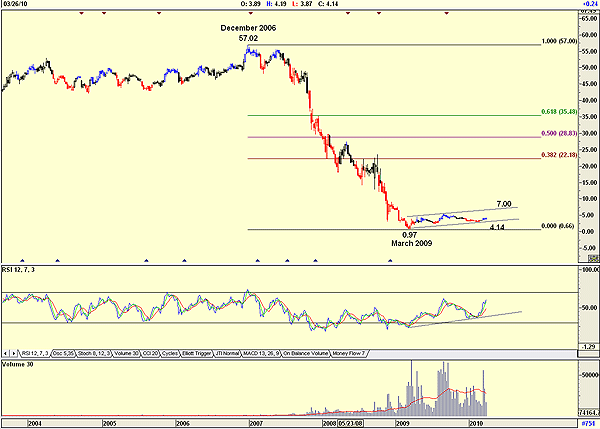
| Figure 1 is a weekly chart, and shows how the price dropped from a high of $57.02 in December 2006 to a low of $0.97 by March 2009. Since that date, the share has slowly risen in value to the price shown on the chart of $4.14, a nice return of more than 400% if you were bold enough to take the plunge, and the volume shows that many did, with volume rising on buys and falling when the price fell, with a strong buy signal. Note too that the relative strength index (RSI) is rising, and has not reached overbought levels. With the Dow Jones Industrial Average (DJIA) in a bull trend, constructing a diversified portfolio on any and every correction in the market, would you add Citigroup to your picks? Weekly charts say yes, with a possible target of $22.18 (38.2% retracement), should the price rise above the resistance line at the $7.00 level. The daily chart shown in Figure 2 will tell you when to buy. |

|
| FIGURE 2: CITIGROUP, DAILY |
| Graphic provided by: OmniTrader. |
| |
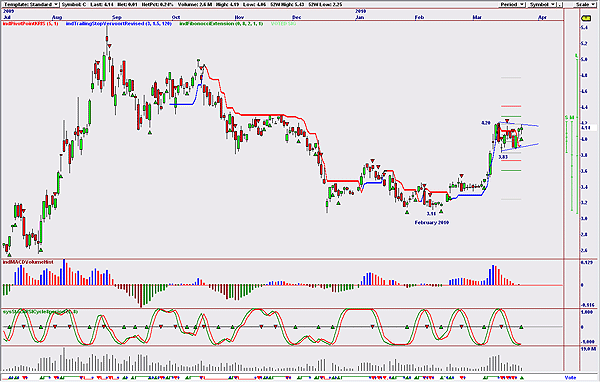
| Figure 2, an Omnitrader chart, shows that the price has risen from a low of $3.11 in February to a high of $4.20 over a period of 18 trading days. Since then, it appears to be forming a consolidation triangle with a target of $4.92 (4.20 - 3.11 = 1.09 + 3.83 = 4.92): a. The vote line, based on a number of strategies that I use, have given a preliminary buy signal. b. The moving average convergence/divergence (MACD) of the volume is still negative, but suggesting a future buy signal soon. c. The stochastic RSI cycle, using an eight-period, has given a buy signal. d. Volume as the price weakened also fell. There is no doubt in my mind that Citigroup is a company that should have a place in a portfolio. Whether you buy now or wait until the resistance line of $4.20 is broken depends on the amount of risk you are prepared to take. Recovery will be slow, and the highs of $57 may take many years to reach, but management is determined that recovery may be quicker than we think. |
Has been a technical analyst since 1969, and has worked as a futures and options trader with First Financial Futures in Johannesburg, South Africa.
| Address: | 3256 West 24th Ave |
| Vancouver, BC | |
| Phone # for sales: | 6042634214 |
| E-mail address: | petroosp@gmail.com |
Click here for more information about our publications!
Comments
Date: 03/26/10Rank: 4Comment:

Request Information From Our Sponsors
- StockCharts.com, Inc.
- Candle Patterns
- Candlestick Charting Explained
- Intermarket Technical Analysis
- John Murphy on Chart Analysis
- John Murphy's Chart Pattern Recognition
- John Murphy's Market Message
- MurphyExplainsMarketAnalysis-Intermarket Analysis
- MurphyExplainsMarketAnalysis-Visual Analysis
- StockCharts.com
- Technical Analysis of the Financial Markets
- The Visual Investor
- VectorVest, Inc.
- Executive Premier Workshop
- One-Day Options Course
- OptionsPro
- Retirement Income Workshop
- Sure-Fire Trading Systems (VectorVest, Inc.)
- Trading as a Business Workshop
- VectorVest 7 EOD
- VectorVest 7 RealTime/IntraDay
- VectorVest AutoTester
- VectorVest Educational Services
- VectorVest OnLine
- VectorVest Options Analyzer
- VectorVest ProGraphics v6.0
- VectorVest ProTrader 7
- VectorVest RealTime Derby Tool
- VectorVest Simulator
- VectorVest Variator
- VectorVest Watchdog
