HOT TOPICS LIST
- MACD
- Fibonacci
- RSI
- Gann
- ADXR
- Stochastics
- Volume
- Triangles
- Futures
- Cycles
- Volatility
- ZIGZAG
- MESA
- Retracement
- Aroon
INDICATORS LIST
LIST OF TOPICS
PRINT THIS ARTICLE
by Donald W. Pendergast, Jr.
System trading can be just plain boring, but compared to the nonstop emotional ups and downs of discretionary trading, trading with a simple and steady mechanical method might be the best choice.
Position: N/A
Donald W. Pendergast, Jr.
Donald W. Pendergast is a financial markets consultant who offers specialized services to stock brokers and high net worth individuals who seek a better bottom line for their portfolios.
PRINT THIS ARTICLE
TRADING SYSTEMS
Simple Strategy For IWM
03/25/10 07:38:01 AMby Donald W. Pendergast, Jr.
System trading can be just plain boring, but compared to the nonstop emotional ups and downs of discretionary trading, trading with a simple and steady mechanical method might be the best choice.
Position: N/A
| Over the past week or so, I've posted the standard and optimized results for the reversed moving average convergence/divergence (MACD) crossover system as backtested on Stillwater (SWC) and Wal-Mart (WMT). The system appears to work well on both trending and trading range stocks across an array of broad market phases (bull, bear, and sideways). Now let's see how the system performed on IWM, the exchange traded fund (ETF) that trades the stocks in the Russell 2000 small-cap index, over the past three years. |

|
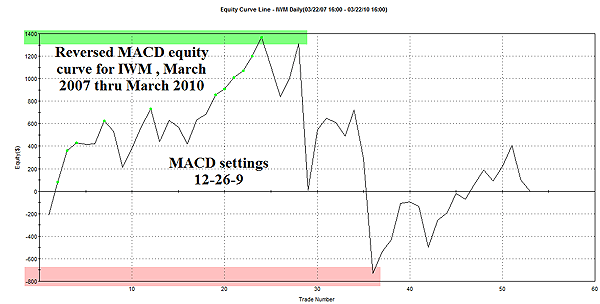
| FIGURE 1: IWM. The 12-26-9 version of the reversed MACD crossover system made some money, lost half of that and finally crawled back to break even. |
| Graphic provided by: TradeStation. |
| |
| In standard trim (12-26-9) the system barely eked out a profit, although it did have a nice runup to nearly $1,400 at one point (Figure 1). Drawdowns were noticeable, but the underwater portion of the equity curve was only about a third as deep as the equity runup was high. I won't bore you with the statistics, as the equity curve shown really tells you all you need to know. For the record, the same money management parameters were used as in the SWC and WMT tests: $10,000 starting balance, $5,000 per trade with a minimum of 60 shares per trade, $0.01 per share commissions and $0.002 per share slippage. Signals occur at the end of day, with the trades being entered at the next session's open. Generally speaking, you would not have wanted to trade the system on IWM with the standard MACD crossover parameters of 12-26-9. Using TradeStation we'll optimize those parameters on IWM over the same set of data, a period that has included a full bear market and an ongoing, record-breaking bull run as well. |

|
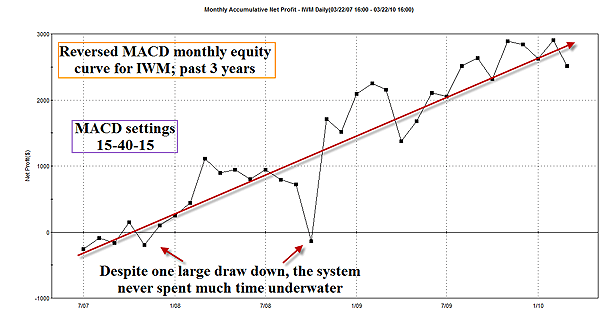
| FIGURE 2: IWM. Optimizing the same system (with new settings of 15-40-15) on the same data results in this much-improved equity curve. Despite one large drawdown, the system has spent little time in negative equity territory. Settings of 21-35-11 and 21-26-15 also produced attractive equity curves and strong profit factors. |
| Graphic provided by: TradeStation. |
| |
| The optimized results produce a profitable equity curve, although it's still easy to see that trading SWC or even WMT with their own versions of this particular system would have been a far better investment of your time and money (Figure 2). As in the SWC and WMT optimizations, all of the runs were verified to have produced decent profits and/or attractive equity curves, and that using an array of input values. For example, the equity curve was obtained with these MACD crossover settings: 15-40-15, which happens to be right in the middle of the range of the top 200 performing optimization runs. This particular run netted $2,548 in profits and a profit factor of 1.77. By way of comparison, run 200 used settings of 21-35-11 and still managed to return $2,430 in profits and a profit factor of 1.65. The best run, optimization 1, was based on settings of 21-26-15 and produced $2,858 in profits and a profit factor of 1.88. Always check your results when optimizing to make sure that the stock, index, or commodity you're testing doesn't give fantastic results with a setting of 14-40-12 only to produce little or no profits when traded with settings of 13-39-12; make sure that there's a wide band of profitability (within reason) across input values, as I've already shown with the IWM optimization. This will help avoid the effects of curve-fitting and the resulting poor trading results that normally occur in the wake of such invalid optimization attempts. |
| The reversed MACD crossover trading system (for more information, see my article in the March 2009 issue of STOCKS & COMMODITIES) works on a variety of trading instruments. The basic premise of the system is explained by David Samborsky of Compuvision, an Australian firm that offers a MetaStock add-on called TradeSim. In the TradeSim user's guide, he detailed that simply reversing the entry and exit triggers on a losing (or poorly performing) trading system can result in a new and suddenly profitable way to extract profits from the markets. The system he used to prove his theory was the standard MACD crossover trading system, the one offered in most charting/systems development packages. Bottom line: If the system you've been testing or trading is a consistent loser, why not fiddle with the entry and exit parameters by reversing them and then seeing if that doesn't help improve your results? It's certainly worth a try. |
Donald W. Pendergast is a financial markets consultant who offers specialized services to stock brokers and high net worth individuals who seek a better bottom line for their portfolios.
| Title: | Writer, market consultant |
| Company: | Linear Trading Systems LLC |
| Jacksonville, FL 32217 | |
| Phone # for sales: | 904-239-9564 |
| E-mail address: | lineartradingsys@gmail.com |
Traders' Resource Links | |
| Linear Trading Systems LLC has not added any product or service information to TRADERS' RESOURCE. | |
Click here for more information about our publications!
Comments
Date: 03/26/10Rank: 1Comment:

Request Information From Our Sponsors
- StockCharts.com, Inc.
- Candle Patterns
- Candlestick Charting Explained
- Intermarket Technical Analysis
- John Murphy on Chart Analysis
- John Murphy's Chart Pattern Recognition
- John Murphy's Market Message
- MurphyExplainsMarketAnalysis-Intermarket Analysis
- MurphyExplainsMarketAnalysis-Visual Analysis
- StockCharts.com
- Technical Analysis of the Financial Markets
- The Visual Investor
- VectorVest, Inc.
- Executive Premier Workshop
- One-Day Options Course
- OptionsPro
- Retirement Income Workshop
- Sure-Fire Trading Systems (VectorVest, Inc.)
- Trading as a Business Workshop
- VectorVest 7 EOD
- VectorVest 7 RealTime/IntraDay
- VectorVest AutoTester
- VectorVest Educational Services
- VectorVest OnLine
- VectorVest Options Analyzer
- VectorVest ProGraphics v6.0
- VectorVest ProTrader 7
- VectorVest RealTime Derby Tool
- VectorVest Simulator
- VectorVest Variator
- VectorVest Watchdog
