HOT TOPICS LIST
- MACD
- Fibonacci
- RSI
- Gann
- ADXR
- Stochastics
- Volume
- Triangles
- Futures
- Cycles
- Volatility
- ZIGZAG
- MESA
- Retracement
- Aroon
INDICATORS LIST
LIST OF TOPICS
PRINT THIS ARTICLE
by Ranjan Jha, CMT
Trading decisions can be simplified if both psychological and mechanical aspects of price action are understood. A combination of candlesticks and Western oscillators does that job well.
Position: Accumulate
Ranjan Jha, CMT
I am a member of the Market Technicians Association and manage a limited partnership investment club in Virginia. Always seek advice from your own Financial Advisor before acting on any method outlined here since every circumstance is different.
PRINT THIS ARTICLE
TECHNICAL INDICATORS
Combo Deals Are Better
03/24/10 08:52:56 AMby Ranjan Jha, CMT
Trading decisions can be simplified if both psychological and mechanical aspects of price action are understood. A combination of candlesticks and Western oscillators does that job well.
Position: Accumulate
| Technical analysis helps investors and traders take an objective approach toward decision-making. However, anyone with a little experience in markets knows that psychology and hence some subjectivity play a crucial role. Western techniques, like the moving average convergence/divergence (MACD), give clear buy or sell signals. At times, though, it's difficult to pull the trigger for nervous investors, particularly when we have been stopped out at a loss acting on the same signals a short time ago. This article tries to show that including simple candlestick charting techniques with oscillators can simplify our decision-making. |
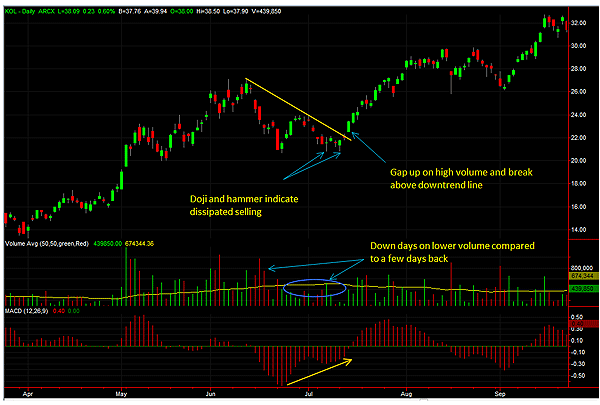
| Figure 1 captures daily price movement of KOL, the coal exchange traded fund (ETF), during the April–September period of 2009. It was — and still is — difficult to be bullish on the prospects of coal with mounting environmental concerns and push for clean energy. However, it pays to see what experts do rather than what they say. The early decline in the second week of June was on heavy volume. The second leg down in late June and early July after a minor bounce took place on relatively lower volume. This indicates abating selling pressure. Volume is a tricky indicator and does not provide clear professional buy or sell interests anymore. It may well be high-frequency intraday trading by hedge funds rather than long-term investments by pension or mutual fund managers. But still, comparing volume of one downleg with the preceding decline can clearly indicate whether selling is accelerating or dissipating. July 8 saw formation of a doji, indicating that struggle between bulls and bears has begun. It was followed by another important bullish indicator hammer on July 13. Significance of these two important reversal indicators was bolstered by price holding above intraday low of June 23 and the MACD (12,26,9) histogram showing bullish divergence. Finally, a gap up above the downtrend line on July 15 clearly signaled that going long has a better probability of a successful trade. Needless to say, regardless of how many mechanical and psychological indicators you have in your favor, a stop below a recent low will preserve your capital. |

|
| FIGURE 1: KOL ETF, DAILY. Candlestick patterns and bullish divergence in the MACD both support subsequent price gaps up. |
| Graphic provided by: TradeStation. |
| |
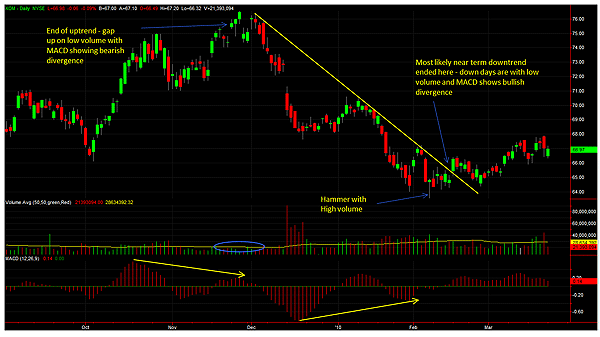
| Let's look at another example that's recent enough and still unfolding. Figure 2 shows a daily chart of the oil giant Exxon (XOM). The uptrend appeared to be ending late November 2009 as the MACD was showing bearish divergence. Trading volume also dried up as price advanced. This top shows three dojis, unlike long green bars in the immediately preceding top. Again, candlesticks are showing psychology of ongoing bull-bear struggle at this peak while the western MACD bearish divergence points to a possible decline. Moving further down the line, the scenery appears to be changing. The down move from the early December 2009 high took place in three legs, each leg showing relatively falling volume. On February 5, bulls fought hard with bears, reflected in the hammer formed on a high volume. Significance of this struggle is enhanced with the MACD histogram showing clear bullish divergence. The intraday low of that hammer still holds and can be used in figuring out stop-losses for any long position. XOM broke above the downtrend line on February 16 and most likely the downtrend of Exxon is over, at least in the short term. |

|
| FIGURE 2: XOM ETF, DAILY. A downtrend and a possible uptrend are both explained using a combination of Eastern and Western techniques. |
| Graphic provided by: TradeStation. |
| |
| In conclusion, any system that combines some form of mechanical indicators with psychological aspects of trading can be used to better understand the supply and demand picture of stocks. Mechanical indicators tell you which way to go, and psychological indicators tells you which team is winning. When both are in sync, then odds of successful trades are higher. |
I am a member of the Market Technicians Association and manage a limited partnership investment club in Virginia. Always seek advice from your own Financial Advisor before acting on any method outlined here since every circumstance is different.
| Address: | 2039 Stone Mill Drive |
| Salem, VA 24153 | |
| Phone # for sales: | 540-330-2911 |
| E-mail address: | ranjanjha@hotmail.com |
Click here for more information about our publications!
Comments
Date: 03/26/10Rank: 3Comment:

Request Information From Our Sponsors
- StockCharts.com, Inc.
- Candle Patterns
- Candlestick Charting Explained
- Intermarket Technical Analysis
- John Murphy on Chart Analysis
- John Murphy's Chart Pattern Recognition
- John Murphy's Market Message
- MurphyExplainsMarketAnalysis-Intermarket Analysis
- MurphyExplainsMarketAnalysis-Visual Analysis
- StockCharts.com
- Technical Analysis of the Financial Markets
- The Visual Investor
- VectorVest, Inc.
- Executive Premier Workshop
- One-Day Options Course
- OptionsPro
- Retirement Income Workshop
- Sure-Fire Trading Systems (VectorVest, Inc.)
- Trading as a Business Workshop
- VectorVest 7 EOD
- VectorVest 7 RealTime/IntraDay
- VectorVest AutoTester
- VectorVest Educational Services
- VectorVest OnLine
- VectorVest Options Analyzer
- VectorVest ProGraphics v6.0
- VectorVest ProTrader 7
- VectorVest RealTime Derby Tool
- VectorVest Simulator
- VectorVest Variator
- VectorVest Watchdog
