HOT TOPICS LIST
- MACD
- Fibonacci
- RSI
- Gann
- ADXR
- Stochastics
- Volume
- Triangles
- Futures
- Cycles
- Volatility
- ZIGZAG
- MESA
- Retracement
- Aroon
INDICATORS LIST
LIST OF TOPICS
PRINT THIS ARTICLE
by Donald W. Pendergast, Jr.
Continuing with last week's test theme of applying the reversed MACD trading system to a variety of high- and low-volatility stocks, this week we look at a three-year backtest of the system on a more stable consumer staples stock, that of Wal-Mart Stores.
Position: N/A
Donald W. Pendergast, Jr.
Donald W. Pendergast is a financial markets consultant who offers specialized services to stock brokers and high net worth individuals who seek a better bottom line for their portfolios.
PRINT THIS ARTICLE
TRADING SYSTEMS
Adventures At Wally World
03/23/10 09:08:33 AMby Donald W. Pendergast, Jr.
Continuing with last week's test theme of applying the reversed MACD trading system to a variety of high- and low-volatility stocks, this week we look at a three-year backtest of the system on a more stable consumer staples stock, that of Wal-Mart Stores.
Position: N/A
| Wal-Mart (WMT). It's a brand name as ubiquitous as Coca Cola, General Motors, McDonalds, and Intel, and a corporation that millions of North Americans rely on for a weekly paycheck. The company's stores truly have become an established sight on the thoroughfares of our cities and towns, and the company's stock is held by scores of institutional and individual investors. Now, while most of us traders don't think twice about going to Wally World for groceries, clothes, auto supplies, housewares, and greeting cards, to be honest, the stock's boring daily price trends have never been of much interest to me — until now. The huge gains for the Wal-Mart "buy & hold & split" crowd are likely a thing of the past (a recent past that includes many fond memories for those who got in early in the mid-1980s when the stock went public, holding on as the stock continued to divide and multiply like an amoeba on steroids), the returns generated from trading WMT with the reversed moving average convergence/divergence (MACD) system over the past three years have been nothing short of outstanding. For starters, let's look at the box-stock reversed MACD system equity curve for the most recent three-year period to see how it performed on WMT shares. |

|
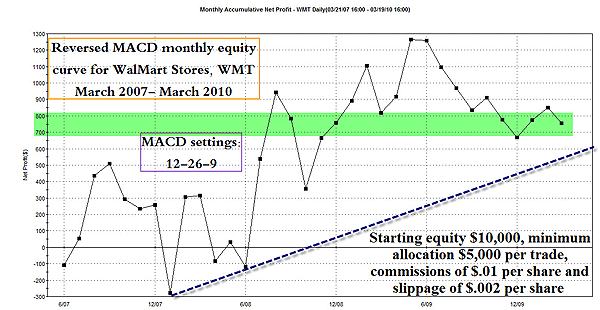
| FIGURE 1: WMT, MONTHLY. The system does show a profit on WMT with standard 12-26-9 settings, but the equity curve is simply too chaotic for a serious trader to consider using the standard version of the system. |
| Graphic provided by: TradeStation. |
| |
| The reversed MACD crossover system simply turns the standard MACD crossover entry and exit signals around and frequently returns positive results on a variety of stocks. Last week, I tested it on a relatively volatile stock that also tends to erupt into powerful trending moves that can last for months at a time, Stillwater Mining Company (SWC), and theorized that the reversed MACD crossover system (RMCS) would most likely return better results on less volatile stocks that weren't especially trendworthy. The RMCS was profitable on SWC using both standard and optimized settings for the MACD crossovers, but both equity curves suffered from substantial drawsdowns from equity highs. While I won't rehash the particulars here, you can find the article "Tuning A Trading System" posted on March 15, 2010, in Traders.com Advantage. WMT's equity curve, using the standard 12-26-9 crossover triggers (reversed), is ragged, but still profitable over the past three years (Figure 1). Even with the standard settings, a trader moving in and out of WMT per the system signals would still have outperformed a typical bank CD returns. Just like SWC, note the substantial profit "give-back" that eroded much of the equity gain runup. These results are based on a starting equity balance of $10,000 and a $5,000 allocation per trade with a minimum of 75 shares per trade. The system is only traded with half the initial account balance to accommodate any system drawdowns that might occur; in real-life, WMT could have been traded with a much smaller cash reserve, thus boosting the annual rate of return substantially. Further, highly skilled traders could even trade WMT on margin, enhancing annual returns even more. The commission was $0.01 per share (or $5 for a 500-share trade) and $0.002 per share was also included for slippage. The system enters and exits at the next session's open after a buy or sell signal is generated and is always in the market. As it is, with the standard 12-26-9 settings for the MACD crossover signals, these are some of the key performance statistics: Number of trades: 57 Net closed profit: $918 (currently, the 12-26-9 version of this system has a [$100+] open drawdown on the latest trade) Average trade: $16.11 Winning percentage: 63.16% Avg. win/avg loss ratio: 0.76 Profit factor: 1.30 Max. consecutive winners: 5 Max. consecutive losers: 3 Max. equity runup: $1,733 Max. drawdown intraday peak to valley: ($1,264) Avg. annual rate of return: 3.14% Okay, so what? Yes, it makes money, beating out a bank CD even when traded through what was perhaps the most vicious bear market in decades (late 2007 through early 2009) since 1973–74 (when the Standard & Poor's 500 lost nearly 50% of its value at one of the fastest rates ever recorded, with the exception of the 1930s market debacle). However, with TradeStation and many other software packages, we can employ some optimization techniques that can substantially improve the performance of this system on WMT. Our next equity curve will demonstrate the current optimized product. |

|
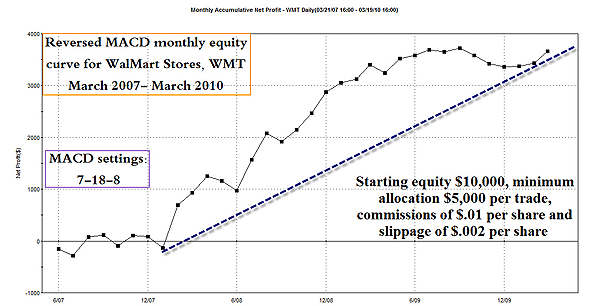
| FIGURE 2: WMT, MONTHLY. Optimization greatly improved the results of the reversed MACD crossover system in WMT. The fact that such a range of setttings also produced similarly shaped equity curves also ensures that the parameters selected (7-18-8) aren't overly curve-fitted. |
| Graphic provided by: TradeStation. |
| |
| Optimizing the system in TradeStation (using the same parameters regarding account size, trade size, commissions, and slippage, and so forth) over the same three-year time period yields a much more appealing equity curve; peak to valley drawdowns were much less severe than with the standard system settings, with the optimized system returning nearly four times the profit. The set of optimized parameters chosen for the reversed MACD crossovers were these: 7-18-8, and the fact that they worked so well on WMT during such pronounced bearish and/or bullish trends in the broad US markets should be enough to convince the most dyed in the wool Wal-Mart "buy & holder" that active trading in Wal-Mart shares can be just as much fun (Figure 2). Here are the key trade performance stats for the optimized system: Number of trades: 97 Net profit: $3,620 Average trade: $37.32 Winning percentage: 70.10% Avg. win/avg loss ratio: .87 Profit factor: 2.03 Max. consecutive winners: 11 Max. consecutive losers: 3 Max. equity runup: $4,290 Max. drawdown intraday peak to valley): ($1,264) Avg. annual rate of return: 11.04% Please note, running the optimization yielded a wide range of profitable outcomes, with 8-40-4 returning the absolute best profit. The optimization results are based on a set of parameters that were exactly in the middle of the top 200 best-performing optimizations of all optimization runs (no. 100 of 200 in all), coming in at 7-18-8. Compared to the equity curve of the optimized SWC system, the optimized WMT curve is very straight and steady, even though it produces substantially lower net profits. Knowing that the system isn't curve-fitted to the nth degree, being stable and profitable (and with similarly shaped equity curves across nearly all 200 of the best-performing optimization runs) should also give added confidence to those who choose to run this system on WMT. |
| So have I proved that the reversed MACD crossover system is more profitable on a trading range stock like WMT rather than on volatile, high-flying trenders like SWC? The answer depends on what you're looking for in a trading system — do you want to make the most money possible, even if it means big drawdowns, or would you feel more comfortable trading stocks that generate more predictable returns with far smaller drawdowns? For those who want simple, black & white answers, here they are: -No, in the sense that the trending, volatile stock returned far greater amounts of net trading profits when traded with the same amounts of money, commissions, and slippage during the same basic time period. -Yes, in the sense that the same basic system applied to a trading range stock demonstrated a far superior equity curve, greater profit factor, and net profit as a percentage of maximum drawdown, even though the absolute dollars in net profit was less than half of that obtained by the system applied to the volatile, trending stock. Hard-core stock profiteers might consider including a variety of volatile and nonvolatile stocks, trading them as a portfolio when using this system. In theory, the trending stocks like SWC should contribute the most in absolute dollars of profit , while the less-volatile stocks like WMT would help provide a rock-solid foundation by virtue of their slower, yet more stable trade returns. This, of course, is a concept that would require a great deal of further testing, preferably with real dollars in a real trading account. For the record, I did trade the standard (12-26-9) reversed MACD trading system with real money during portions of 2009 and was generally pleased with its performance, which was enhanced by using a few simple broad market timing filters, as I was trading stocks from the long side only. Your job now is to take the ideas presented in this article and to further polish and refine them until they truly become something unique, profitable, and dependable. Are you up to the task? For those who are, the results could be well worth the time and effort required. |
Donald W. Pendergast is a financial markets consultant who offers specialized services to stock brokers and high net worth individuals who seek a better bottom line for their portfolios.
| Title: | Writer, market consultant |
| Company: | Linear Trading Systems LLC |
| Jacksonville, FL 32217 | |
| Phone # for sales: | 904-239-9564 |
| E-mail address: | lineartradingsys@gmail.com |
Traders' Resource Links | |
| Linear Trading Systems LLC has not added any product or service information to TRADERS' RESOURCE. | |
Click here for more information about our publications!
Comments
Date: 03/24/10Rank: 2Comment:

Request Information From Our Sponsors
- StockCharts.com, Inc.
- Candle Patterns
- Candlestick Charting Explained
- Intermarket Technical Analysis
- John Murphy on Chart Analysis
- John Murphy's Chart Pattern Recognition
- John Murphy's Market Message
- MurphyExplainsMarketAnalysis-Intermarket Analysis
- MurphyExplainsMarketAnalysis-Visual Analysis
- StockCharts.com
- Technical Analysis of the Financial Markets
- The Visual Investor
- VectorVest, Inc.
- Executive Premier Workshop
- One-Day Options Course
- OptionsPro
- Retirement Income Workshop
- Sure-Fire Trading Systems (VectorVest, Inc.)
- Trading as a Business Workshop
- VectorVest 7 EOD
- VectorVest 7 RealTime/IntraDay
- VectorVest AutoTester
- VectorVest Educational Services
- VectorVest OnLine
- VectorVest Options Analyzer
- VectorVest ProGraphics v6.0
- VectorVest ProTrader 7
- VectorVest RealTime Derby Tool
- VectorVest Simulator
- VectorVest Variator
- VectorVest Watchdog
