HOT TOPICS LIST
- MACD
- Fibonacci
- RSI
- Gann
- ADXR
- Stochastics
- Volume
- Triangles
- Futures
- Cycles
- Volatility
- ZIGZAG
- MESA
- Retracement
- Aroon
INDICATORS LIST
LIST OF TOPICS
PRINT THIS ARTICLE
by Chaitali Mohile
The bullish rally of Office Depot has reached an important support area. Will the stock resume the existing upward action?
Position: N/A
Chaitali Mohile
Active trader in the Indian stock markets since 2003 and a full-time writer. Trading is largely based upon technical analysis.
PRINT THIS ARTICLE
TECHNICAL INDICATORS
The Vertical Rally Halts
03/22/10 11:02:46 AMby Chaitali Mohile
The bullish rally of Office Depot has reached an important support area. Will the stock resume the existing upward action?
Position: N/A
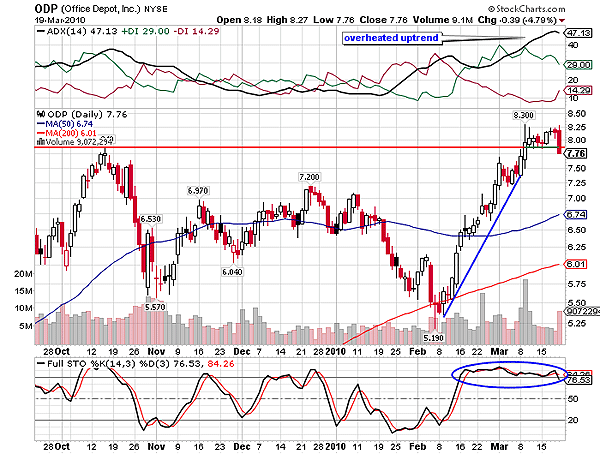
| Since February 2010, Office Depot stock (ODP) has gained $3. Volume steadily increased as ODP rushed higher; $7.75 was the previous high pivot that would have obstructed the bullish journey. By that time, the price rally reached resistance at 7.75 levels, the uptrend was very well developed, and the full stochastic (14,3,3) in Figure 1 was moving upward from an oversold region. Thus, the bullish momentum helped the rally establish robust support at 7.75 levels. The green line of the support- resistance tool shows the newly formed support in Figure 1. The volumes were encouraging throughout the rally. |

|
| FIGURE 1: FIGURE 1: ODP, DAILY. Due to the overheated uptrend, ODP has failed to establish the support at 7.76 levels. |
| Graphic provided by: StockCharts.com. |
| |
| However, the average directional movement index (ADX) (14) surged in an overheated uptrend region above 40 levels, leading to the consolidation of the price rally. ODP consolidated for almost a week as the ADX (14) proceeded in the overheated area. In addition, the stochastic oscillator moved flat in an overbought territory, suggesting stability in the bullish rally. But for traders, it was time to book profits on the rally, as the consolidation can whipsaw the good positions. Since both indicators in Figure 1 were highly bullish, ODP is likely to retrace and retest the previous supports. Thus, profit-taking would be a wiser decision. Currently, the ADX (14) and full stochastic (14,3,3) are tipping down, suggesting the possibility of a bearish rally within the next few days. The next supports for ODP are just a few points lower at 7.76 and 6.74, but no short positions are recommended as the stock has two major moving average supports of the 50-day and the 200-day in Figure 1. |
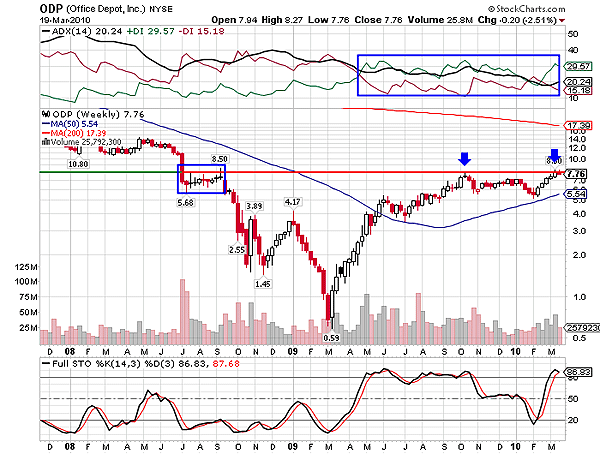
| On a weekly basis, ODP has hit its historical resistance at $7.76. We can see in Figure 2 that the stock challenged the resistance three times. Earlier in 2008, ODP consolidated at this level (see the blue box) before the final drop. During the pullback rally in 2009, the stock marginally bounced from 7.76 levels and witnessed a small bearish rally. The ADX (14) was ranging in the developing uptrend levels between 25 and 30. Thus, the relief rally lacked the bullish pressure to violate the resistance line. The full stochastic was volatile in an overbought area in 2009 and later plunged to an oversold level of 20. As a result, ODP retraced to its 50-day MA support. Thereafter, the relief rally was initiated with the 50-day support. |

|
| FIGURE 2: ODP, WEEKLY. The stock has hit the major resistance at 7.76 three times. |
| Graphic provided by: StockCharts.com. |
| |
| Along with the price rally, the ADX (14) also surged from 19 levels with huge buying pressure and the stochastic oscillator reached the overbought levels. Recently, ODP has hit the resistance at 7.76, but the indicators have not turned stronger. Since, $7.76 has been hit three times the level has accumulated robust strength to obstruct any bullish rally. ODP can be a stock to consider after the resistance breakout. Traders need to wait to trigger the long positions till the uptrend develops and the stochastic sustains in the bullish region. |
| To conclude, the bullish rally of ODP has temporarily halted and is likely to retrace towards its previous lows. |
Active trader in the Indian stock markets since 2003 and a full-time writer. Trading is largely based upon technical analysis.
| Company: | Independent |
| Address: | C1/3 Parth Indraprasth Towers. Vastrapur |
| Ahmedabad, Guj 380015 | |
| E-mail address: | chaitalimohile@yahoo.co.in |
Traders' Resource Links | |
| Independent has not added any product or service information to TRADERS' RESOURCE. | |
Click here for more information about our publications!
Comments
Date: 03/22/10Rank: 3Comment:

Request Information From Our Sponsors
- StockCharts.com, Inc.
- Candle Patterns
- Candlestick Charting Explained
- Intermarket Technical Analysis
- John Murphy on Chart Analysis
- John Murphy's Chart Pattern Recognition
- John Murphy's Market Message
- MurphyExplainsMarketAnalysis-Intermarket Analysis
- MurphyExplainsMarketAnalysis-Visual Analysis
- StockCharts.com
- Technical Analysis of the Financial Markets
- The Visual Investor
- VectorVest, Inc.
- Executive Premier Workshop
- One-Day Options Course
- OptionsPro
- Retirement Income Workshop
- Sure-Fire Trading Systems (VectorVest, Inc.)
- Trading as a Business Workshop
- VectorVest 7 EOD
- VectorVest 7 RealTime/IntraDay
- VectorVest AutoTester
- VectorVest Educational Services
- VectorVest OnLine
- VectorVest Options Analyzer
- VectorVest ProGraphics v6.0
- VectorVest ProTrader 7
- VectorVest RealTime Derby Tool
- VectorVest Simulator
- VectorVest Variator
- VectorVest Watchdog
