HOT TOPICS LIST
- MACD
- Fibonacci
- RSI
- Gann
- ADXR
- Stochastics
- Volume
- Triangles
- Futures
- Cycles
- Volatility
- ZIGZAG
- MESA
- Retracement
- Aroon
INDICATORS LIST
LIST OF TOPICS
PRINT THIS ARTICLE
by Chaitali Mohile
The breakout of an inverted head & shoulders pattern of Wynn Resorts turned sideways under the moving average resistance, and the stock is waiting for another breakout.
Position: Buy
Chaitali Mohile
Active trader in the Indian stock markets since 2003 and a full-time writer. Trading is largely based upon technical analysis.
PRINT THIS ARTICLE
BREAKOUTS
WYNN Waits For Breakout
03/16/10 03:43:57 PMby Chaitali Mohile
The breakout of an inverted head & shoulders pattern of Wynn Resorts turned sideways under the moving average resistance, and the stock is waiting for another breakout.
Position: Buy
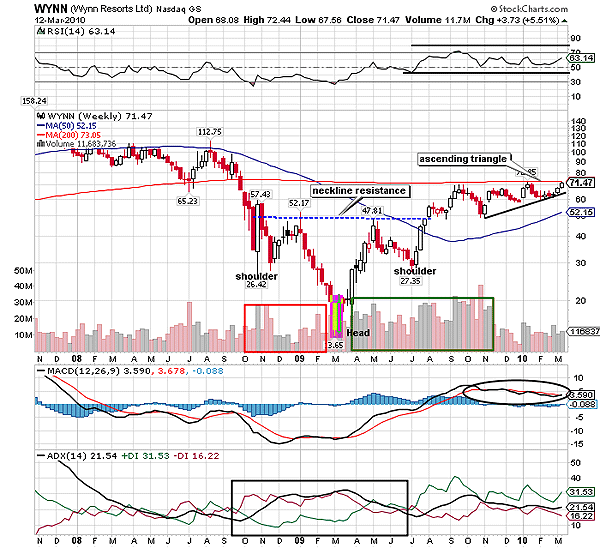
| Wynn Resorts (WYNN) formed an inverted head & shoulders pattern — a bullish reversal pattern — in 2008–09. During the formation of the left shoulder and the left portion of the head, the volume shrank. However, as WYNN surged from $13.65, forming a bullish engulfing pattern, the buyers' volume gradually improved. The price rally continued and WYNN witnessed a huge buying pressure, reversing the downtrend. Soon, the inverted head & shoulders pattern was visible on the weekly time frame in Figure 1. The heavy flow of volume confirms the trend reversal formation with the neckline resistance at $50. The breakout was supposed to meet the target of 50 - 14 = 36 + 50 = 86, calculated by adding the length of the head to the breakout level that is the neckline. But the breakout had a robust resistance at the 200-day moving average (MA), and as a result, WYNN failed to reach its targeted level. |

|
| FIGURE 1: WYNN, WEEKLY. The purple block at the bottom of the chart shows the bullish engulfing pattern that initiated a fresh rally. The stock thereafter formed the head and the right shoulder. |
| Graphic provided by: StockCharts.com. |
| |
| The stock turned sideways with a stable upper range and an ascending lower range, and thus, an ascending triangle was formed in Figure 1. The 200-day MA resistance formed the upper range. The ascending triangle is a bullish continuation pattern in an existing uptrend. The average directional movement index (ADX) (14) is above the 20 levels, suggesting a developing uptrend. Therefore, the pattern breakout will resume the existing bullish rally and would hit the minimum estimated levels of $86 (inverted head & shoulders). The moving average convergence/divergence (MACD) (12,26,9) is tangled with the trigger line in positive territory, suggesting lowering momentum, and the relative strength index (RSI) (14) is moving within the bullish region of 50 and 70 levels. Therefore, the bullish breakout is not likely to slow till the bullish momentum is developed. |
| The ascending triangle's potential target is measured as 70 - 50 = 20 + 70 = 90. Thus, the targets of both patterns are in close vicinity. WYNN is a stock to be added to your watchlist. The weekly chart is a medium-term chart, so traders should enter the stock considering this time frame. The bullish breakout can definitely be bought. |
Active trader in the Indian stock markets since 2003 and a full-time writer. Trading is largely based upon technical analysis.
| Company: | Independent |
| Address: | C1/3 Parth Indraprasth Towers. Vastrapur |
| Ahmedabad, Guj 380015 | |
| E-mail address: | chaitalimohile@yahoo.co.in |
Traders' Resource Links | |
| Independent has not added any product or service information to TRADERS' RESOURCE. | |
Click here for more information about our publications!
Comments
Date: 03/17/10Rank: 2Comment:

Request Information From Our Sponsors
- StockCharts.com, Inc.
- Candle Patterns
- Candlestick Charting Explained
- Intermarket Technical Analysis
- John Murphy on Chart Analysis
- John Murphy's Chart Pattern Recognition
- John Murphy's Market Message
- MurphyExplainsMarketAnalysis-Intermarket Analysis
- MurphyExplainsMarketAnalysis-Visual Analysis
- StockCharts.com
- Technical Analysis of the Financial Markets
- The Visual Investor
- VectorVest, Inc.
- Executive Premier Workshop
- One-Day Options Course
- OptionsPro
- Retirement Income Workshop
- Sure-Fire Trading Systems (VectorVest, Inc.)
- Trading as a Business Workshop
- VectorVest 7 EOD
- VectorVest 7 RealTime/IntraDay
- VectorVest AutoTester
- VectorVest Educational Services
- VectorVest OnLine
- VectorVest Options Analyzer
- VectorVest ProGraphics v6.0
- VectorVest ProTrader 7
- VectorVest RealTime Derby Tool
- VectorVest Simulator
- VectorVest Variator
- VectorVest Watchdog
