HOT TOPICS LIST
- MACD
- Fibonacci
- RSI
- Gann
- ADXR
- Stochastics
- Volume
- Triangles
- Futures
- Cycles
- Volatility
- ZIGZAG
- MESA
- Retracement
- Aroon
INDICATORS LIST
LIST OF TOPICS
PRINT THIS ARTICLE
by Ron Walker
The primary momentum indicator should always be price. To measure true momentum in price, many technical traders turn to candlesticks to help predict market direction for both long- and short-term periods.
Position: N/A
Ron Walker
Ron Walker is an active trader and technical analyst. He operates an educational website dedicated to the study of Technical Analysis. The website offers free market analysis with daily video presentations and written commentaries. Ron is a video pioneer, being one of the first to utilize the internet producing Technical Analysis videos. His website is thechartpatterntrader.com
PRINT THIS ARTICLE
CANDLESTICK CHARTING
A Shooting Star For Bank Of America
03/15/10 02:22:50 PMby Ron Walker
The primary momentum indicator should always be price. To measure true momentum in price, many technical traders turn to candlesticks to help predict market direction for both long- and short-term periods.
Position: N/A
| As traders, we should always be on the lookout for reversals. And one of the best ways to spot a reversal is by using candlesticks. A trader can greatly improve his or her odds by just simply learning a few candlestick patterns. It can make all the difference in the world by raising your awareness to a potential shift in momentum. Then after identifying a reversal candle pattern, we can wait for a confirming price close below or above the reversal pattern to validate it. Candle patterns are composed of single-line and multiple-lined patterns. |

|
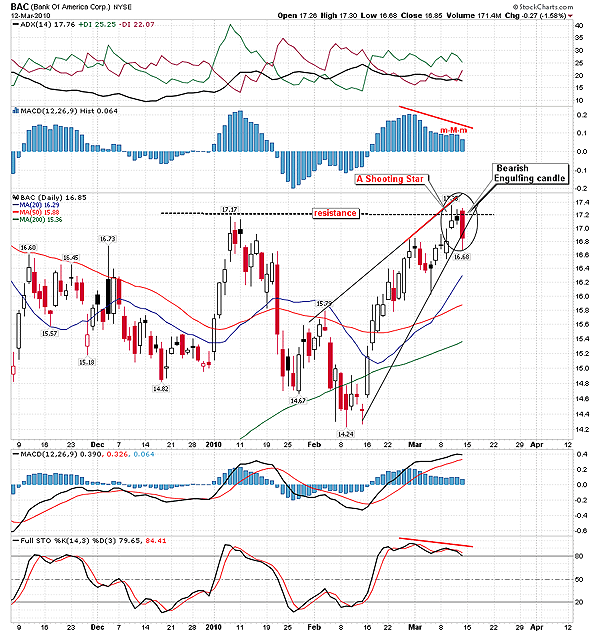
| FIGURE 1: BAC, DAILY. As BAC slams into the January resistance, a shooting star appears, which received a confirming close two sessions later as a bearish engulfing candle closed below the low that was set the day when the shooting star appeared. |
| Graphic provided by: StockCharts.com. |
| |
| In Figure 1, Bank of America Corp. (BAC) has formed a potential one-line reversal pattern on its daily chart called a shooting star. Greg Morris, a leading authority on candlestick patterns, points out in his outstanding book Candlestick Charting Explained, that a shooting star pattern occurs when a stock or index gaps up at the open and rallies to a new high, but then closes near the low of the session, causing a long upper shadow to form above the real body of the candle. The long upper shadow in the pattern represents a dramatic decline in momentum to the upside and hints of a potential reversal to come. The real body of the shooting star pattern should be narrow, and the upper shadow should be at least twice as long as the real body. While the lower shadow should be virtually nonexistent, according to Morris. The shooting star pattern must appear in a mature uptrend. In this case, the shooting star pattern was revealed just as BAC was rallying into resistance from its January high, greatly increasing the odds of a reversal. The chances of success escalated even higher with the appearance of a bearish rising wedge chart pattern. |
| The shooting star pattern was followed by a black spinning top candlestick. Black solid candlesticks often appear near peaks and occur if the previous days closing value is less than the closing value for the current day. Both of those candlesticks were followed by a long red candlestick, which engulfed both of the prior candles. Usually the first day of a two-line bearish engulfing pattern is a white candlestick that reflects the trend. However, we cannot ignore the bearishness of the engulfing candle that took BAC down by more than 1.50% and broke the rising trendline of the rising wedge pattern. Further, the engulfing candle allowed prices to close below the low set during the shooting star pattern, thus confirming that pattern. Momentum indicators confirm the legitimacy of this reversal represented by the moving average convergence/divergence (MACD) histogram (12, 26, 9) and the stochastic (14). The MACD histogram formed a bearish divergence and then ticked lower when the black candle formed. That day, a bearish m-M-m pattern completed on the histogram. The bearish m-M-m pattern was confirmed the following day just as the bearish engulfing candle appeared. Meanwhile, the stochastic has also completed a bearish divergence, crossing below its signal line and falling below 80, dropping out of overbought territory. |
| The m-M-m pattern is simply shorthand for a change in the direction of the slope. Alexander Elder, in his book Trading For A Living, assigns capital and lower-case letters for the height and depth of the histogram bars. When the bars increase in length like in m-M, the slope is rising. It is the third m that identifies the change in slope, which ultimately has the ability to shift momentum. The bearish m-M-m pattern has better odds of success when it appears in the histogram as it traces a lower high, and completes a bearish divergence. The shift in the momentum indicators may soon show up in the trend falling indicators such as the MACD (12, 26, 9) and the average directional movement indicator (ADX) (14). The MACD is overextended and moving sideways, while the ADX line has dropped below both the positive and negative directional lines (+DI/-DI) as it hovers below 20. That implies weakness in the current uptrend. If a reversal is to transpire, the ADX line needs to rally and begin to rise once -DI has crossed above +DI. |

|
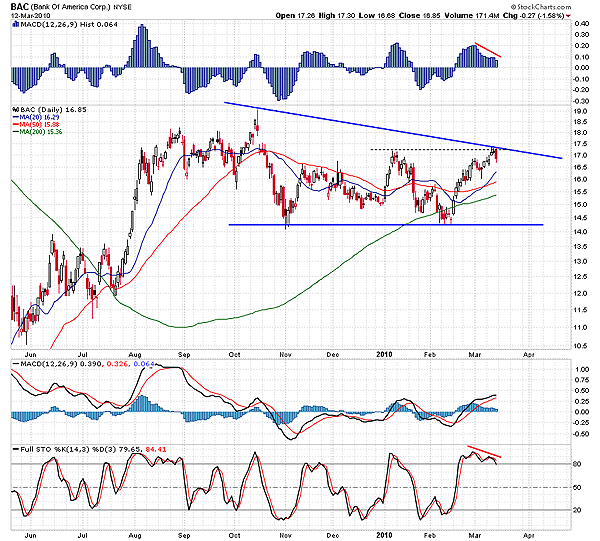
| FIGURE 2: BAC, DAILY. A hard reversal at overhead resistance could carve out a very large descending triangle. Note that the high made in October occurred while a shooting star pattern was forming, which was followed by a sharp decline. |
| Graphic provided by: StockCharts.com. |
| |
| Figure 1 reveals that BAC had gained about three points in approximately one month and gaining approximately 22% in that time, suggesting that prices have overheated. The rising wedge may want to evolve into a rising price channel as prices correct back to the 50-day moving average (MA). Once that test has completed, prices may gain the necessary traction to clear this current level of resistance. However, should prices fall below the 20-, 50-, and 200-day MA, BAC would slip into a bearish state that would likely cause prices to test the February lows again. If BAC takes that path, it may setup a very large bearish descending triangle pattern on its daily chart (see Figure 2). |
Ron Walker is an active trader and technical analyst. He operates an educational website dedicated to the study of Technical Analysis. The website offers free market analysis with daily video presentations and written commentaries. Ron is a video pioneer, being one of the first to utilize the internet producing Technical Analysis videos. His website is thechartpatterntrader.com
| Website: | thechartpatterntrader.com |
| E-mail address: | thechartpatterntrader@gmail.com |
Click here for more information about our publications!
Comments
Date: 03/16/10Rank: 4Comment:

Request Information From Our Sponsors
- StockCharts.com, Inc.
- Candle Patterns
- Candlestick Charting Explained
- Intermarket Technical Analysis
- John Murphy on Chart Analysis
- John Murphy's Chart Pattern Recognition
- John Murphy's Market Message
- MurphyExplainsMarketAnalysis-Intermarket Analysis
- MurphyExplainsMarketAnalysis-Visual Analysis
- StockCharts.com
- Technical Analysis of the Financial Markets
- The Visual Investor
- VectorVest, Inc.
- Executive Premier Workshop
- One-Day Options Course
- OptionsPro
- Retirement Income Workshop
- Sure-Fire Trading Systems (VectorVest, Inc.)
- Trading as a Business Workshop
- VectorVest 7 EOD
- VectorVest 7 RealTime/IntraDay
- VectorVest AutoTester
- VectorVest Educational Services
- VectorVest OnLine
- VectorVest Options Analyzer
- VectorVest ProGraphics v6.0
- VectorVest ProTrader 7
- VectorVest RealTime Derby Tool
- VectorVest Simulator
- VectorVest Variator
- VectorVest Watchdog
