HOT TOPICS LIST
- MACD
- Fibonacci
- RSI
- Gann
- ADXR
- Stochastics
- Volume
- Triangles
- Futures
- Cycles
- Volatility
- ZIGZAG
- MESA
- Retracement
- Aroon
INDICATORS LIST
LIST OF TOPICS
PRINT THIS ARTICLE
by Donald W. Pendergast, Jr.
Comparing the performance of a trading system's equity curve in relation to the trend of the particular market that generated the trading signals may help traders maximize their system's profitability.
Position: N/A
Donald W. Pendergast, Jr.
Donald W. Pendergast is a financial markets consultant who offers specialized services to stock brokers and high net worth individuals who seek a better bottom line for their portfolios.
PRINT THIS ARTICLE
TRADING SYSTEMS
Tuning A Trading System
03/15/10 02:17:27 PMby Donald W. Pendergast, Jr.
Comparing the performance of a trading system's equity curve in relation to the trend of the particular market that generated the trading signals may help traders maximize their system's profitability.
Position: N/A
| My article "Trade System Evaluation," published in the March 2009 Technical Analysis of STOCKS & COMMODITIES, featured the long-term backtested results of the reversed moving average convergence/divergence (MACD) crossover system. Tested on NASDAQ 100 component stocks over a nearly 19-year period on daily data, the system proved to be a stable if somewhat slow performer, one able to produce profits in most stocks during bull, bear, and sideways markets. In this piece, however, I wanted to test the system on a single stock basis, testing the basic reversed MACD system on a volatile mining stock, Stillwater Mining Company (SWC). My basic theory is that the box-stock settings of the reversed MACD crossover system work best on stocks that regularly trace out a trading range (user-defined; your definition of a trading range market may differ from mine) market rather than those that tend to spend a lot of time in extended up- or downtrending phases. Knowing that SWC tends to embark upon explosive long-term trending moves from time to time, I wanted to see how this stock performed with this system over the past three years, a period that saw several outstanding trend moves in this particular miner. Let's have a look at the basic system's output over the past three years. |

|
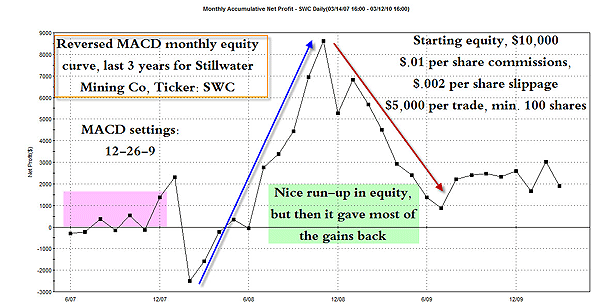
| FIGURE 1: REVERSED MACD, MONTHLY. If a system gives back nearly all of its hard-won gains, it might be time to go back to the ol' drawing board. |
| Graphic provided by: TradeStation. |
| |
| Figure 1 is the equity curve for SWC using the standard 12-26-9 settings for the reversed MACD crossover system, (remember, this system goes long when the normal MACD crossover system signals a short trade and it goes short when the normal MACD crossover system signals a long trade). Yes, it made money overall, but look at how bad the drawdown was from the equity high of $8,700; in the end, all you would have retained was about $1,900 after three years of trading this particular system. These results are based on a starting equity balance of $10,000 and a $5,000 allocation per trade with a minimum of 100 shares per trade. The commission was $0.01 per share (or $5 for a 500-share trade) and $0.002 per share was also included for slippage. The system enters and exits at the next session's open after a buy or sell signal is generated and is always in the market. As is, with the standard 12-26-9 settings for the MACD crossover signals, these are some of the key performance stats: Number of trades: 58 Net closed profit: $3,077 (currently, the 12-26-9 version of this system has a ($1,000 +) open drawdown on the latest trade) Average trade: $52.15 Winning percentage: 62.71% Avg win/avg loss ratio: .69 Profit factor: 1.17 Max consec winners: 5 Max consec losers: 3 Max equity runup: $13,872 Max drawdown intraday peak to valley): ($9,863) While it's reassuring to know that the reversed MACD crossover system makes money in SWC over the past three years, surely there must be a way to smooth out that awful equity curve? Indeed there is, and let's have a look at the new and improved equity curve now. |

|
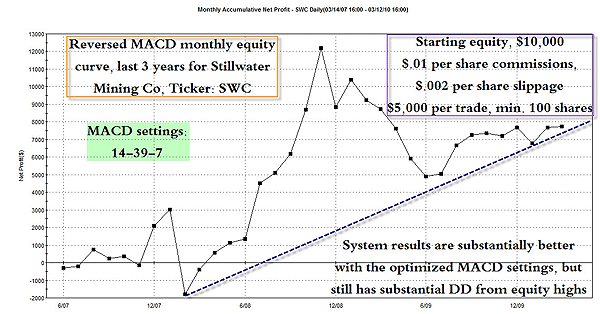
| FIGURE 2: REVERSED MACD, MONTHLY. Optimizing the reversed MACD system with new settings (14-39-7) greatly improved overall profitability and tradability of the system on SWC. The system still gives up a lot of the gains on a drawdown, however. |
| Graphic provided by: TradeStation. |
| |
| Optimizing the system in TradeStation (using the same parameters regarding account size, trade size, commissions and slippage, and so forth) over the same three-year time period yields a much more profitable equity curve; it gave back about half of the maximum gains at one point, but still made a much greater amount of money overall. The best set of parameters for the reversed MACD crossovers were these: 14-39-7, and the fact that they worked so well over a period of several large trending phases in the underlying stock (SWC) during the past three years is also cause for a bit of optimism (Figure 2). Here are the key trade performance stats for the optimized system: Number of trades: 57 Net profit: $8,304 Average trade: $145.68 Winning percentage: 71.93% Avg win/avg loss ratio: .58 Profit factor: 1.49 Max consec winners: 8 Max consec losers: 3 Max equity runup: $16,722 Max drawdown intraday peak to valley): ($9,897) Optimization resulted in superior backtested performance, but is there still a way to reduce the large drawdown that appeared in both the stock and optimized versions of this system? Without getting too complicated, let's take a look at SWC's price chart for the past three years and see if there isn't an aspect of this stock's price behavior that might clue us in on how to minimize future system drawdowns. |

|
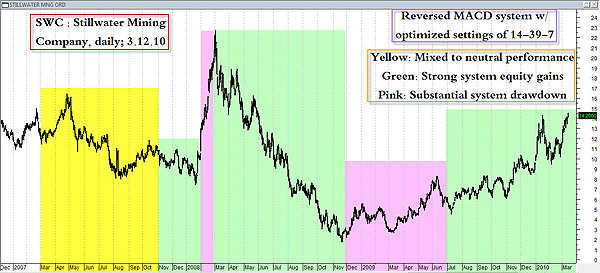
| FIGURE 3: SWC, DAILY. Over the past three years, the best period of profitability for the 14-39-7 reversed MACD system in SWC occurred during the massive bear market of February 2008 through November 2008. By way of comparison, the system appears to be less robust during bullish market phases. |
| Graphic provided by: MetaStock. |
| |
| Figure 3 is the three-year daily chart for SWC; using the optimized system's equity curve characteristics, I've colored the price chart to indicate periods of mixed to neutral system performance (yellow), periods of strong equity gains (green), and periods of substantial system equity drawdown (pink). Honestly, in the case of SWC, there doesn't seem to be an obvious linkage between the stock's price trend and the direction of the system's equity curve (and remember, this system is always in the market, long or short, regardless of the trend of the stock), with one exception -- the system appeared to outperform when SWC went into a major bear market, such as the one that began in February 2008 and lasted into November 2008. However, during a less intense bear phase that lasted from April 2007 to January 2008, the system basically produced little to no lasting equity gains at all. Note also how when SWC rocketed higher during January and February of 2008 (thin pink-shaded box on chart), the system failed to adapt and caused a nearly ($5,000) system drawdown. Finally, even though SWC has been in a generally bullish posture since the major reversal made in November 2008, the system still has not reclaimed the equity highs attained during the long bear market phase described earlier. All we can really say with any degree of certainty here is that this 14-39-7 version of the reversed MACD system in SWC appears to do very well during long bear market phases and that it also is marginally profitable during all other market phases, and all of that only applicable during this particular three-year period. |
| Overall, the 14-39-7 version of the reversed MACD trading system appears to be somewhat in tune with SWC's underlying price dynamics during the past three years. Your job now is to see if you can determine how to better filter trade signal entries in order to boost profitability and to minimize the amount of money that this system gives back after making new equity highs. And here's a hint: moving average filters don't seem to have much effect on improving overall trade results in this particular system. See if you can determine how to best reduce the maximum drawdown in this particular system, if you can. Meanwhile, in a future article, I hope to compare the performance of this same system on a trading range kind of stock, one that's less volatile than SWC, to see if my original theory regarding this system holds water -- or not. |
Donald W. Pendergast is a financial markets consultant who offers specialized services to stock brokers and high net worth individuals who seek a better bottom line for their portfolios.
| Title: | Writer, market consultant |
| Company: | Linear Trading Systems LLC |
| Jacksonville, FL 32217 | |
| Phone # for sales: | 904-239-9564 |
| E-mail address: | lineartradingsys@gmail.com |
Traders' Resource Links | |
| Linear Trading Systems LLC has not added any product or service information to TRADERS' RESOURCE. | |
Click here for more information about our publications!
Comments
Date: 03/16/10Rank: 2Comment:

Request Information From Our Sponsors
- StockCharts.com, Inc.
- Candle Patterns
- Candlestick Charting Explained
- Intermarket Technical Analysis
- John Murphy on Chart Analysis
- John Murphy's Chart Pattern Recognition
- John Murphy's Market Message
- MurphyExplainsMarketAnalysis-Intermarket Analysis
- MurphyExplainsMarketAnalysis-Visual Analysis
- StockCharts.com
- Technical Analysis of the Financial Markets
- The Visual Investor
- VectorVest, Inc.
- Executive Premier Workshop
- One-Day Options Course
- OptionsPro
- Retirement Income Workshop
- Sure-Fire Trading Systems (VectorVest, Inc.)
- Trading as a Business Workshop
- VectorVest 7 EOD
- VectorVest 7 RealTime/IntraDay
- VectorVest AutoTester
- VectorVest Educational Services
- VectorVest OnLine
- VectorVest Options Analyzer
- VectorVest ProGraphics v6.0
- VectorVest ProTrader 7
- VectorVest RealTime Derby Tool
- VectorVest Simulator
- VectorVest Variator
- VectorVest Watchdog
