HOT TOPICS LIST
- MACD
- Fibonacci
- RSI
- Gann
- ADXR
- Stochastics
- Volume
- Triangles
- Futures
- Cycles
- Volatility
- ZIGZAG
- MESA
- Retracement
- Aroon
INDICATORS LIST
LIST OF TOPICS
PRINT THIS ARTICLE
by Koos van der Merwe
President Barack Obama may soon be called the nuclear industry's golden boy, since no US President in the last three decades has put more taxpayer dollars behind atom power.
Position: Accumulate
Koos van der Merwe
Has been a technical analyst since 1969, and has worked as a futures and options trader with First Financial Futures in Johannesburg, South Africa.
PRINT THIS ARTICLE
HEAD & SHOULDERS
Going For Uranium
03/12/10 09:42:35 AMby Koos van der Merwe
President Barack Obama may soon be called the nuclear industry's golden boy, since no US President in the last three decades has put more taxpayer dollars behind atom power.
Position: Accumulate
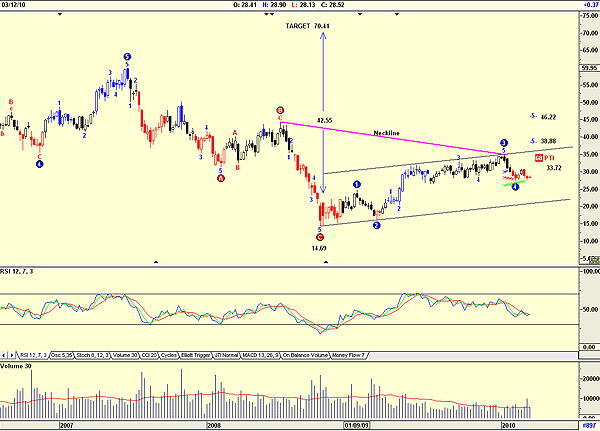
| Cameco (CCO-T) is one of the world's largest uranium producers, accounting for 15% of world production from its mines in Canada and the US. Their leading position is backed by about 500 million pounds of proven and probable reserves and extensive resources. Cameco holds premier land positions in the world's most promising areas for new uranium discoveries in Canada and Australia as part of an intensive global exploration program. Cameco is also a leading provider of processing services required to produce fuel for nuclear power plants and generates 1,000 MW of clean electricity through a partnership in North America's largest nuclear generating station located in Ontario, Canada. What do the charts say? Figure 1 is a weekly that shows the following: |

|
| FIGURE 1: CAMECO, WEEKLY |
| Graphic provided by: AdvancedGET. |
| |
| a. A possible inverted head & shoulders pattern with a target of $70.41 is the price break above the neckline at $33.72 (42.55 - 14.69 = 27.86 + 42.55 = 70.41). I refer this as "possible" because it does not look exactly like the inverted head & shoulders pattern we are accustomed to seeing. b. Advanced GET's Elliott wave projections suggest a fifth-wave target of $38.88 and $46.22. c. The relative strength index (RSI) shown on the chart is suggesting weakness, and volume does appear to be static. |

|
| FIGURE 2: CAMECO, DAILY |
| Graphic provided by: OmniTrader. |
| |
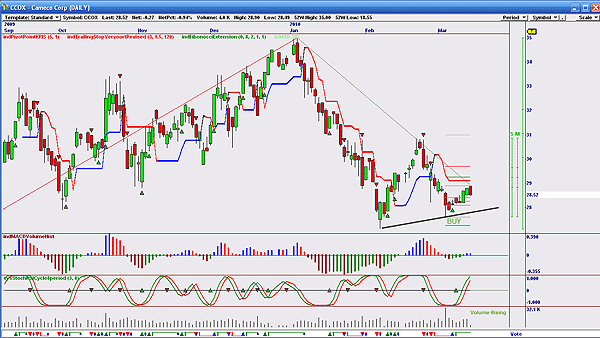
| Figure 2 is a daily chart using the OmniTrader program that, after a great deal of work by myself, in developing strategies, shows the following: a. The chart shows that the vote line gave a buy signal four days ago. b. The MACDVolume indicator is in buy mode. c. The stochastic RSI cycle 8 period indicator has given a buy signal. d. The price is testing the downward trendline. e. Volume is rising as the price rises. The first nuclear power stations that President Obama says will be built in the US will only become operative in about 10 years' time, and only if the US Congress puts party politics behind and places the well-being of the US citizenry as primary, but it does appear as if investors are starting to buy shares in major uranium producers. Never forget, the market always anticipates. |
Has been a technical analyst since 1969, and has worked as a futures and options trader with First Financial Futures in Johannesburg, South Africa.
| Address: | 3256 West 24th Ave |
| Vancouver, BC | |
| Phone # for sales: | 6042634214 |
| E-mail address: | petroosp@gmail.com |
Click here for more information about our publications!
Comments
Date: 03/14/10Rank: 3Comment:
Date: 03/15/10Rank: 1Comment:

Request Information From Our Sponsors
- StockCharts.com, Inc.
- Candle Patterns
- Candlestick Charting Explained
- Intermarket Technical Analysis
- John Murphy on Chart Analysis
- John Murphy's Chart Pattern Recognition
- John Murphy's Market Message
- MurphyExplainsMarketAnalysis-Intermarket Analysis
- MurphyExplainsMarketAnalysis-Visual Analysis
- StockCharts.com
- Technical Analysis of the Financial Markets
- The Visual Investor
- VectorVest, Inc.
- Executive Premier Workshop
- One-Day Options Course
- OptionsPro
- Retirement Income Workshop
- Sure-Fire Trading Systems (VectorVest, Inc.)
- Trading as a Business Workshop
- VectorVest 7 EOD
- VectorVest 7 RealTime/IntraDay
- VectorVest AutoTester
- VectorVest Educational Services
- VectorVest OnLine
- VectorVest Options Analyzer
- VectorVest ProGraphics v6.0
- VectorVest ProTrader 7
- VectorVest RealTime Derby Tool
- VectorVest Simulator
- VectorVest Variator
- VectorVest Watchdog
