HOT TOPICS LIST
- MACD
- Fibonacci
- RSI
- Gann
- ADXR
- Stochastics
- Volume
- Triangles
- Futures
- Cycles
- Volatility
- ZIGZAG
- MESA
- Retracement
- Aroon
INDICATORS LIST
LIST OF TOPICS
PRINT THIS ARTICLE
by Donald W. Pendergast, Jr.
One of the weaker stocks in the S&P 500, Gamestop, staged a noticeable reversal today. But will this move have follow-through ability?
Position: Accumulate
Donald W. Pendergast, Jr.
Donald W. Pendergast is a financial markets consultant who offers specialized services to stock brokers and high net worth individuals who seek a better bottom line for their portfolios.
PRINT THIS ARTICLE
ACCUM./DIST. CHAIKIN
Gamestop Reversal At Hand?
03/12/10 11:53:01 AMby Donald W. Pendergast, Jr.
One of the weaker stocks in the S&P 500, Gamestop, staged a noticeable reversal today. But will this move have follow-through ability?
Position: Accumulate
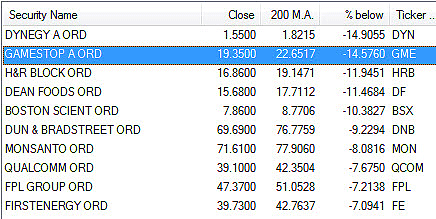
| Running the MetaStock long-term bearish exploration on the Standard & Poor's 500 component stocks reveals that Gamestop (GME) is nearly 15% below its 200-day exponential moving average (EMA) and is also one of only 39 stocks of the 500 in the index that are below that critical long-term trend-delineating average. So why would anybody even want to analyze, much less take a position, in such a lagging large-cap issue? We'll examine GME's daily chart to see if we can discern why the stock may be at the early stages of a trend reversal, but first let's check out the long-term bearish exploration results, focusing on the 10 poorest performing stocks (based on how far beneath their respective 200-day EMAs they are). |

|
| FIGURE 1: THE LOWEST. Only 39 of the S&P 500's component stocks are below their respective 200-day EMAs; here are the 10 stocks that are the farthest below that key moving average. |
| Graphic provided by: MetaStock. |
| Graphic provided by: Metastock's Explorer. |
| |
| Figure 1 is the exploration output; only Dynegy (DYN) is further below its 200-day EMA than GME. Dynegy is also manifesting some telltale signs of a potential trend reversal, but GME's long-term money flow pattern appears to be a bit more bullish. Now, before going any further here, be advised that the broad markets have covered a lot of ground since reversing higher off of their respective 200-day EMAs about five weeks ago; the Russell 2000 is up more than 16% since then, and even the large-cap behemoth called the S&P 500 has also done exceptionally well. Either index could turn on a dime, beginning a new corrective and/or reversal to lower levels. If that happens, even GME is probably going to cool off a bit, but for now, the uptrends in the broad markets are still intact. Now, let's look at GME's daily graph for some very interesting (and very bullish) technical clues (Figure 2). |

|
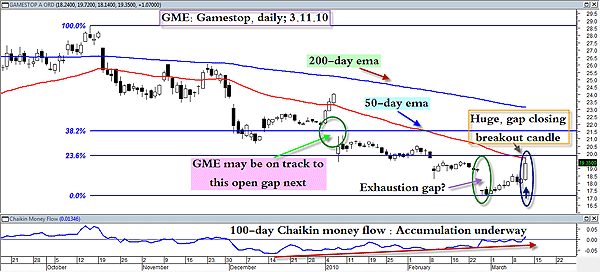
| FIGURE 2: GME, DAILY. With its bullish money flow divergence, gap-filling breakout candle and substantially inverse correlation (0.52) to the S&P 500 index over the past six months, GME might be an interesting contrarian play should the broad markets begin another selloff. |
| Graphic provided by: MetaStock. |
| |
| At times, various stocks, exchange traded funds (ETFs), and commodities are kind enough to provide plenty of advance warning as to their next moves, up or down, and this may also be the case here with GME. All of the bells and whistles are going off with this one: * The long-term Chaikin money flow (CMF)(100) confirms that mucho dinero has been flowing into GME for the past several months. This is known as a bullish divergence from price action and is a fairly reliable leading indicator of an impending trend reversal. * Thursday's huge breakout candle took price back up to its 21-day EMA, filling the recent exhaustion gap (see two ovals on Figure 2). The next open gap spans an equidistant price zone on either side of the Fibonacci 38% retracement of the October 2009 to February 2010 decline; given the power of the breakout move, this could be the most logical price magnet that might draw the price of GME shares up toward at least the Fibonacci 38% level near $21.50. Again, the response of GME's price action in the wake of a sharp S&P 500 reversal will also be a key factor determining just how soon that open gap will get filled. Over the past three years GME has a close correlation with the S&P 500 of 0.78 (a value of 1.00 means perfect correlation) but is substantially inversely correlated to that index over the past six months, coming in with a reading of (0.52). If the inverse correlation relation continues for a time, perhaps GME will continue to climb even if the broad markets sneeze. Anyway, this is a very interesting situation shaping up here in GME, one worth keeping tabs on for a while. |
| Playing GME might involve setting up a covered call trade; an April 2010 covered call with a $19 strike price will fetch more than 54% annualized if the stock is called away at expiration. Here are the specifics: Buy 100 shares of GME, currently at $19.35 Sell one GME April $19 call option for $1.45 or better ------------------------------------------------------ Net cost of approximately $1,795 per covered call Setting a get-out (stop-loss) price of about $17.00 for this stock/option combo will ensure that your losses will be relatively mild in the case of a sudden, sharp reversal lower. Meanwhile, you can use key swing lows to help trail a stop if the stock continues to move higher; for example, if GME manages a daily close above its 21-day EMA at $19.75, raising the stop-loss/trail up close to Tuesday's low at $17.88 would be a very wise move indeed. With covered calls, you can usually give the stock more room to move around (within reason) so that you're not needlessly stopped out on a minor whipsaw. |
| Summing up, GME is a large-cap stock that is under accumulation; today's break higher may be the first stage of a run toward higher prices, with the open gap between $21.94 and $21.17 being its first tentative target area. |
Donald W. Pendergast is a financial markets consultant who offers specialized services to stock brokers and high net worth individuals who seek a better bottom line for their portfolios.
| Title: | Writer, market consultant |
| Company: | Linear Trading Systems LLC |
| Jacksonville, FL 32217 | |
| Phone # for sales: | 904-239-9564 |
| E-mail address: | lineartradingsys@gmail.com |
Traders' Resource Links | |
| Linear Trading Systems LLC has not added any product or service information to TRADERS' RESOURCE. | |
Click here for more information about our publications!
Comments
Date: 03/15/10Rank: 1Comment:
Date: 03/16/10Rank: 2Comment:

Request Information From Our Sponsors
- StockCharts.com, Inc.
- Candle Patterns
- Candlestick Charting Explained
- Intermarket Technical Analysis
- John Murphy on Chart Analysis
- John Murphy's Chart Pattern Recognition
- John Murphy's Market Message
- MurphyExplainsMarketAnalysis-Intermarket Analysis
- MurphyExplainsMarketAnalysis-Visual Analysis
- StockCharts.com
- Technical Analysis of the Financial Markets
- The Visual Investor
- VectorVest, Inc.
- Executive Premier Workshop
- One-Day Options Course
- OptionsPro
- Retirement Income Workshop
- Sure-Fire Trading Systems (VectorVest, Inc.)
- Trading as a Business Workshop
- VectorVest 7 EOD
- VectorVest 7 RealTime/IntraDay
- VectorVest AutoTester
- VectorVest Educational Services
- VectorVest OnLine
- VectorVest Options Analyzer
- VectorVest ProGraphics v6.0
- VectorVest ProTrader 7
- VectorVest RealTime Derby Tool
- VectorVest Simulator
- VectorVest Variator
- VectorVest Watchdog
