HOT TOPICS LIST
- MACD
- Fibonacci
- RSI
- Gann
- ADXR
- Stochastics
- Volume
- Triangles
- Futures
- Cycles
- Volatility
- ZIGZAG
- MESA
- Retracement
- Aroon
INDICATORS LIST
LIST OF TOPICS
PRINT THIS ARTICLE
by Austin Passamonte
Cyclical stocks can be a good place to start when looking for an economic recovery.
Position: N/A
Austin Passamonte
Austin is a private trader who trades emini stock index futures intraday. He currently trades various futures markets from home in addition to managing a trader's educational forum
PRINT THIS ARTICLE
CYCLES
Cyclicals At Support?
12/06/01 11:39:51 AMby Austin Passamonte
Cyclical stocks can be a good place to start when looking for an economic recovery.
Position: N/A
| If the economy is truly in early stages of recovery--with no false starts this time, we can look toward cyclical stocks to lead the way. After all, which group uses both raw materials and new technology combined to fill consumer spending insatiable demands! |
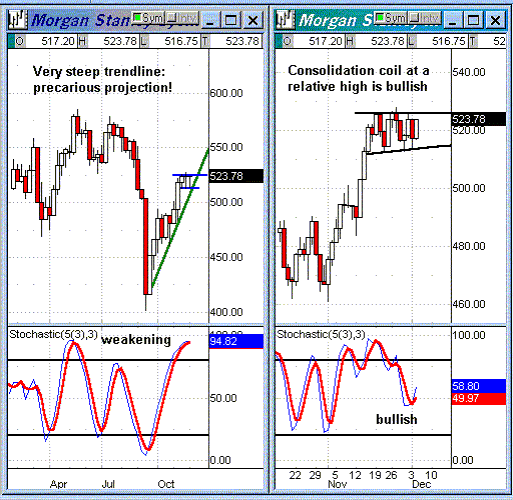
| Since late September lows we've seen a steep but intact trendline walking the Morgan Stanley Cyclical Index [CYC] higher (Figure 1). A three-week sideways pause had some bulls wondering and bears itching to go short, but that might be premature. Weekly chart stochastic values are within overbought extremes and possibly weakening, but daily charts show the move within that weekly chart picture has price action poised to rise. |

|
| Figure 1: Weekly/Daily Charts Morgan Stanley Cyclical Index |
| Graphic provided by: Quote.com. |
| Graphic provided by: QCharts. |
| |
| Note the price action coiled near relative recent highs. For the past thirteen sessions straight (at the time of this writing) price action has coiled its strength for the next directional move. Which way will it be? One can never be sure, but a price coil usually continues the direction from which price action entered. That coupled with stochastic values making a clearly bullish reversal from near oversold extreme strongly suggest it will be upward once more. |
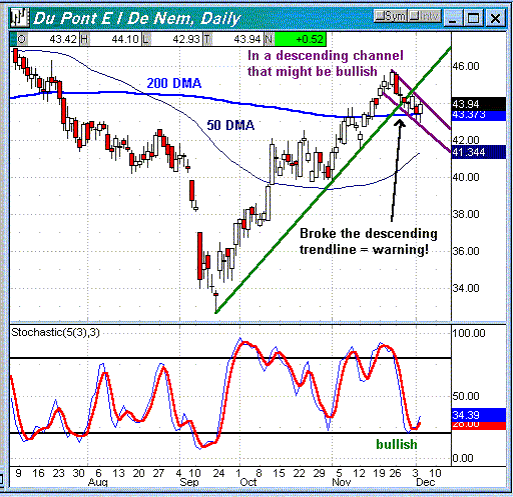
 Figure 2: Weekly/Daily Charts - XOI CBOE Oil Index Graphics courtesy of Qcharts @quote.com DuPont is one such cyclical that also walked a similar steep line of ascent but recently broke below the measure. It has since formed a bullish flag or channel as price action sits on its 200 DMA with stochastic values reversing up from oversold extreme in bullish fashion. A close above the $44 level should position this one for an assault on $45+ to resume the trendline climb. |
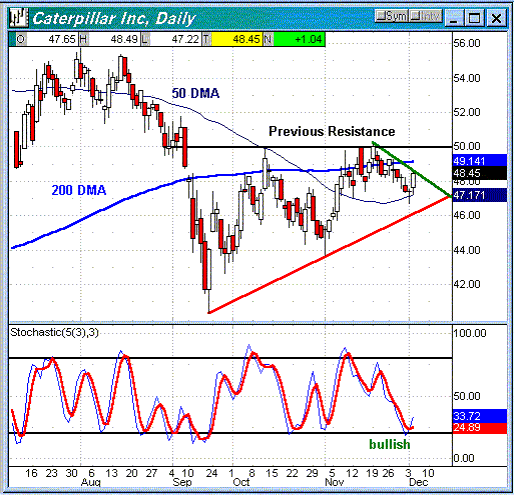
 Figure 3: Daily Chart - Caterpillar [CAT] Graphics courtesy of Qcharts @quote.com "Big CAT" on the other hand looks relatively stronger than DD by comparison. It has held above a more gradual sloping trendline with no breaks. CAT is also resting on it's 50-DMA for support and looks to break above wedge resistance as stochastic values begin a bullish reversal from oversold extreme. Many components of the CYC index and other cyclical stocks all look quite like these examples right now, which indicate the first week of December should see a resumption in the current rally from here. |
Austin is a private trader who trades emini stock index futures intraday. He currently trades various futures markets from home in addition to managing a trader's educational forum
| Title: | Individual Trader |
| Company: | CoiledMarkets.com |
| Address: | PO Box 633 |
| Naples, NY 14512 | |
| Website: | coiledmarkets.com/blog |
| E-mail address: | austinp44@yahoo.com |
Traders' Resource Links | |
| CoiledMarkets.com has not added any product or service information to TRADERS' RESOURCE. | |
Click here for more information about our publications!
Comments
Date: 12/12/01Rank: 4Comment:

Request Information From Our Sponsors
- StockCharts.com, Inc.
- Candle Patterns
- Candlestick Charting Explained
- Intermarket Technical Analysis
- John Murphy on Chart Analysis
- John Murphy's Chart Pattern Recognition
- John Murphy's Market Message
- MurphyExplainsMarketAnalysis-Intermarket Analysis
- MurphyExplainsMarketAnalysis-Visual Analysis
- StockCharts.com
- Technical Analysis of the Financial Markets
- The Visual Investor
- VectorVest, Inc.
- Executive Premier Workshop
- One-Day Options Course
- OptionsPro
- Retirement Income Workshop
- Sure-Fire Trading Systems (VectorVest, Inc.)
- Trading as a Business Workshop
- VectorVest 7 EOD
- VectorVest 7 RealTime/IntraDay
- VectorVest AutoTester
- VectorVest Educational Services
- VectorVest OnLine
- VectorVest Options Analyzer
- VectorVest ProGraphics v6.0
- VectorVest ProTrader 7
- VectorVest RealTime Derby Tool
- VectorVest Simulator
- VectorVest Variator
- VectorVest Watchdog
