HOT TOPICS LIST
- MACD
- Fibonacci
- RSI
- Gann
- ADXR
- Stochastics
- Volume
- Triangles
- Futures
- Cycles
- Volatility
- ZIGZAG
- MESA
- Retracement
- Aroon
INDICATORS LIST
LIST OF TOPICS
PRINT THIS ARTICLE
by Chaitali Mohile
Check Point Software Technologies has been consolidating in a wide range for the past few years, and the stock is likely to witness a bright future.
Position: Buy
Chaitali Mohile
Active trader in the Indian stock markets since 2003 and a full-time writer. Trading is largely based upon technical analysis.
PRINT THIS ARTICLE
CONSOLID FORMATION
CHKP Surges From Long Consolidation Period
03/05/10 12:40:57 PMby Chaitali Mohile
Check Point Software Technologies has been consolidating in a wide range for the past few years, and the stock is likely to witness a bright future.
Position: Buy
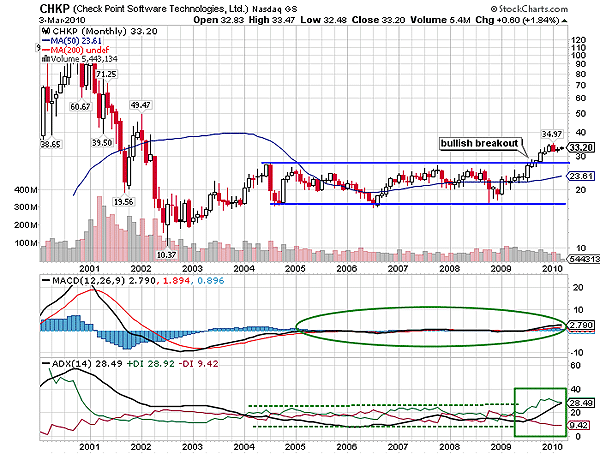
| Check Point Software Technologies (CHKP) was consolidating for about six years. Since mid-2004, CHKP has been moving between $18 and $30. The upper and lower boundaries of the range were respected throughout the consolidation phase, forming a perfect horizontal channel (Figure 1). The price movement within the channel created several trading opportunities. During 2004-09, the average directional movement index (ADX) (14) showed equal buying and selling pressure on the trend. As a result, the ADX remained below 20 levels, indicating the consolidation for CHKP. In a similar way, the moving average convergence/divergence (MACD) (12,2,6,9) failed to rush in either direction. The momentum indicator merged with the zero line for the entire period, indicating lack of momentum to move the price to either side of the consolidation range. Thus, the bulls and the bears were equally strong. |

|
| FIGURE 1: CHKP, MONTHLY. After the bullish breakout of the channel, the ADX (14) suggested the developing uptrend and the MACD (12,26,9) showed bullish momentum in the rally. |
| Graphic provided by: StockCharts.com. |
| |
| The horizontal channel in Figure 1 opened trading opportunities for position traders. The price movement from the upper range to the lower one and vice versa is a simple trading strategy for the horizontal channel. Due to the wide range consolidation, trading CHKP was safe and simple. A robust rally emerges if either end of the range is breached. In Figure 1, the monthly time frame shows us that the horizontal channel broke upward in 2009. This signifies a bullish rally. Since then, CHKP has gained about eight points. The bullish breakout was like a jackpot for those already long from the lower range of the channel. Meanwhile, the MACD (12,26,9) surged in positive territory and the ADX (14) shifted above 20 levels with huge buying pressure, developing a fresh uptrend. Considering these bullish notes, new demand rushed in at the breakout levels. The long-term view for CHKP is highly bullish; many good buying opportunities would arise during this bullish journey. |
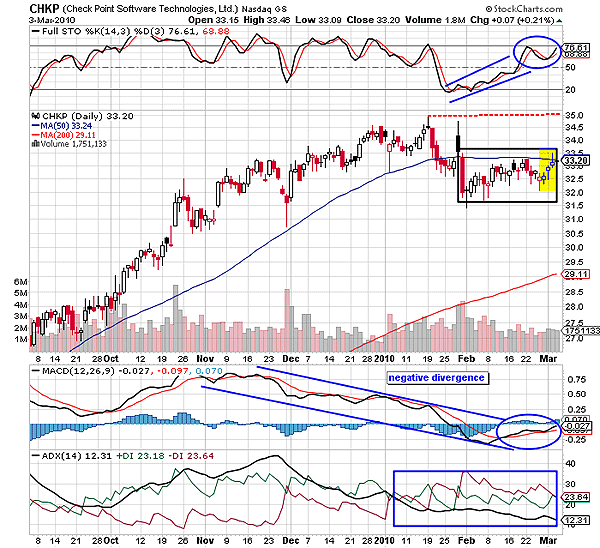
| To understand the short-term trading aspects, let us refer to the daily time frame. According to Figure 1, there was a divergence between the huge bullish rally from October 2009 and the MACD (12,26,9). The indicator moved down while CHKP surged. Although the negative divergence induced high volatility in the rally, the stock moved higher and higher. The descending uptrend was another reason for the volatility. Finally, the stock plunged from the new high at $35 and violated the 50-day moving average (MA) support. Thereafter, the stock consolidated under the new MA resistance. |

|
| FIGURE 2: CHKP, DAILY. The stock was consolidating under the 50-day MA resistance. |
| Graphic provided by: StockCharts.com. |
| |
| The yellow block in Figure 2 highlights small bullish candles, indicating the possibility of a bullish MA breakout. But the size of the candles and the long shadows at both sides shows lack of confidence. In addition, the ADX (14) has slipped below the 15 levels, signifying weakness in the trend. However, the bullish crossover of MACD (12,26,9) in negative territory and an overbought full stochastic (14,3,3) are marginally bullish. Therefore, traders have to wait for the confirmed moving average breakout. Fresh long positions can be triggered only if CHKP establishes support at the 50-day moving average. |
| Thus, CHKP is one of the best stocks for short-term as well as long-term traders and investors. |
Active trader in the Indian stock markets since 2003 and a full-time writer. Trading is largely based upon technical analysis.
| Company: | Independent |
| Address: | C1/3 Parth Indraprasth Towers. Vastrapur |
| Ahmedabad, Guj 380015 | |
| E-mail address: | chaitalimohile@yahoo.co.in |
Traders' Resource Links | |
| Independent has not added any product or service information to TRADERS' RESOURCE. | |
Click here for more information about our publications!
Comments
Date: 03/08/10Rank: 2Comment:

Request Information From Our Sponsors
- VectorVest, Inc.
- Executive Premier Workshop
- One-Day Options Course
- OptionsPro
- Retirement Income Workshop
- Sure-Fire Trading Systems (VectorVest, Inc.)
- Trading as a Business Workshop
- VectorVest 7 EOD
- VectorVest 7 RealTime/IntraDay
- VectorVest AutoTester
- VectorVest Educational Services
- VectorVest OnLine
- VectorVest Options Analyzer
- VectorVest ProGraphics v6.0
- VectorVest ProTrader 7
- VectorVest RealTime Derby Tool
- VectorVest Simulator
- VectorVest Variator
- VectorVest Watchdog
- StockCharts.com, Inc.
- Candle Patterns
- Candlestick Charting Explained
- Intermarket Technical Analysis
- John Murphy on Chart Analysis
- John Murphy's Chart Pattern Recognition
- John Murphy's Market Message
- MurphyExplainsMarketAnalysis-Intermarket Analysis
- MurphyExplainsMarketAnalysis-Visual Analysis
- StockCharts.com
- Technical Analysis of the Financial Markets
- The Visual Investor
