HOT TOPICS LIST
- MACD
- Fibonacci
- RSI
- Gann
- ADXR
- Stochastics
- Volume
- Triangles
- Futures
- Cycles
- Volatility
- ZIGZAG
- MESA
- Retracement
- Aroon
INDICATORS LIST
LIST OF TOPICS
PRINT THIS ARTICLE
by Donald W. Pendergast, Jr.
When big-name stocks severely lag the broad market indexes, look for possible short setups as the S&P 500 maxes out on the current upswing.
Position: N/A
Donald W. Pendergast, Jr.
Donald W. Pendergast is a financial markets consultant who offers specialized services to stock brokers and high net worth individuals who seek a better bottom line for their portfolios.
PRINT THIS ARTICLE
RATE CHANGE - PRICE
As Broad Market Peaks, A Possible Short For MOT
03/04/10 09:13:15 AMby Donald W. Pendergast, Jr.
When big-name stocks severely lag the broad market indexes, look for possible short setups as the S&P 500 maxes out on the current upswing.
Position: N/A
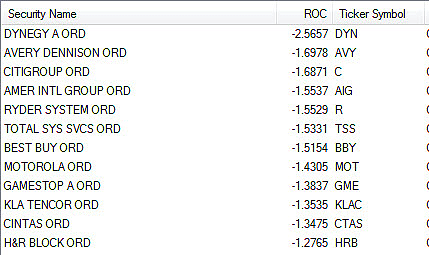
| The Standard & Poor's 500 and Russell 2000 indexes (along with many others) have enjoyed a nice runup since staging major intraday reversals off of (or in close proximity to) their respective 200-day exponential moving averages (EMAs). Now, however, the lopsided short-term imbalance of the NYSE advance/decline line suggests that a reversal/correction of the current upswing may be getting ripe for an appearance. In addition, the indexes are at or near Fibonacci resistance levels, made very apparent to even non-Fibonacci adherents by today's intraday reversals off of the session highs. We'll start with a look at the big-cap stocks most severely lagging the S&P 500 and then zoom in for a closer look at the current technical standing of one of its best-known component stocks. See Figure 1. |

|
| FIGURE 1: WEAK S&P 500 COMPONENTS. Here are 12 weak S&P 500 components that could be prime short sales on the next broad market selloff. Motorola (MOT) looks especially vulnerable in the days just ahead. |
| Graphic provided by: MetaStock. |
| Graphic provided by: MetaStock Explorer. |
| |
| Based on a simple 13-week rate of change (ROC) calculation, here are the weakest stocks in the S&P 500 as of March 3, 2010. Anytime that a big-cap stock fails to participate in a major rally could mean that such a stock might be an attractive short sale once the broad market peaks out and starts to correct. While any of these stocks could be worth further study, one in particular, Motorola (MOT), features very poor money flow — making it especially attractive to potential short-sellers. |

|
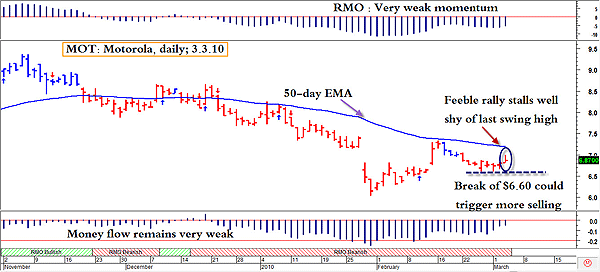
| FIGURE 2: MOT, DAILY. Weak momentum, rotten money flow, and poor relative strength all combine to portray MOT as a likely short-sale candidate on the next reversal swing in the S&P 500. A break of $6.60 could be the trigger to take MOT back down to its February lows. |
| Graphic provided by: MetaStock. |
| Graphic provided by: Rahul Mohindar indicators from MetaStock v.11. |
| |
| As Figure 2 shows, Motorola's chart isn't anything to write home about; the Chaikin money flow (CMF)(34) is negative, the Rahul Mohindar oscillator (RMO) is also negative (below its zero-line), and the feeble rally in the stock has failed to even bring it up to the 50-day EMA line, which is also sloping downward. Of special note is the red RMO ribbon at the bottom of the chart — it's been in bearish mode for nearly three months now. Just as in the big indexes, note the substantial intraday reversal on Wednesday March 3, 2010, a sign that all is not well in stock-market land. So here's a setup for you to monitor: 1. On a break below $6.60, sell MOT short, placing a stop-loss to cover at about $6.90. 2. Try to hold on for a ride down toward $6.29 (a minor swing low support level); take at least half profits and set the stop-loss to break even if $6.29 is reached. More adventurous types might want to hold on for a possible retest of the February low at $6.04, but be very quick to close out the trade at the first hint of a short-covering rally. When the S&P 500 stages a reversal and/or correction, the impact on weak relative strength stocks like MOT can be pronounced, so keep an eye on this setup over the next few sessions. |
| Selling short isn't going to win you any popularity contests with your "buy & hold and hope" mutual fund pals, but since I assume you're trading to generate real income, that minor inconvenience shouldn't pose too much of a problem for the truly committed equity traders among us. |
Donald W. Pendergast is a financial markets consultant who offers specialized services to stock brokers and high net worth individuals who seek a better bottom line for their portfolios.
| Title: | Writer, market consultant |
| Company: | Linear Trading Systems LLC |
| Jacksonville, FL 32217 | |
| Phone # for sales: | 904-239-9564 |
| E-mail address: | lineartradingsys@gmail.com |
Traders' Resource Links | |
| Linear Trading Systems LLC has not added any product or service information to TRADERS' RESOURCE. | |
Click here for more information about our publications!
Comments
Date: 03/08/10Rank: 4Comment:

Request Information From Our Sponsors
- StockCharts.com, Inc.
- Candle Patterns
- Candlestick Charting Explained
- Intermarket Technical Analysis
- John Murphy on Chart Analysis
- John Murphy's Chart Pattern Recognition
- John Murphy's Market Message
- MurphyExplainsMarketAnalysis-Intermarket Analysis
- MurphyExplainsMarketAnalysis-Visual Analysis
- StockCharts.com
- Technical Analysis of the Financial Markets
- The Visual Investor
- VectorVest, Inc.
- Executive Premier Workshop
- One-Day Options Course
- OptionsPro
- Retirement Income Workshop
- Sure-Fire Trading Systems (VectorVest, Inc.)
- Trading as a Business Workshop
- VectorVest 7 EOD
- VectorVest 7 RealTime/IntraDay
- VectorVest AutoTester
- VectorVest Educational Services
- VectorVest OnLine
- VectorVest Options Analyzer
- VectorVest ProGraphics v6.0
- VectorVest ProTrader 7
- VectorVest RealTime Derby Tool
- VectorVest Simulator
- VectorVest Variator
- VectorVest Watchdog
