HOT TOPICS LIST
- MACD
- Fibonacci
- RSI
- Gann
- ADXR
- Stochastics
- Volume
- Triangles
- Futures
- Cycles
- Volatility
- ZIGZAG
- MESA
- Retracement
- Aroon
INDICATORS LIST
LIST OF TOPICS
PRINT THIS ARTICLE
by Koos van der Merwe
The bull is definitely there. The matador, however, is frustrated by the lack of action as the bull just yawns and relaxes. What can he do to get it moving?
Position: Buy
Koos van der Merwe
Has been a technical analyst since 1969, and has worked as a futures and options trader with First Financial Futures in Johannesburg, South Africa.
PRINT THIS ARTICLE
ELLIOTT WAVE
Prepare For A Slow Bull
03/04/10 08:20:35 AMby Koos van der Merwe
The bull is definitely there. The matador, however, is frustrated by the lack of action as the bull just yawns and relaxes. What can he do to get it moving?
Position: Buy
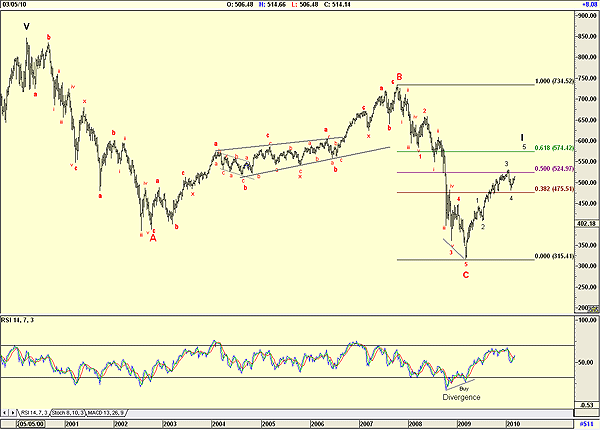
| Figure 1 is almost self-explanatory. It is a Standard & Poor's 100 weekly chart and shows quite clearly that the index is currently in a Wave 5 Of a Wave I. The bears out there, calling for a double-dip recession, have probably given the bull a sleeping pill, but they simply cannot find the key to open the lock and let the bear in. All they have done is slow the bull down, and forced you, the matador, to the limits of your frustration as the market moves up slowly in its Wave 5 of Wave I. Why am I so convinced of my forecast? Well, look at the chart: -The first rule in Elliott wave theory as theorized by Robert Prechter in his book Elliott Wave Principle is that the wave count must look right, something the bears appear to have forgotten. The wave count in the chart does look correct, and above all, it is a simple count. -The relative strength index (RSI) is bullish after a divergence buy. Note how obvious the previous sell signals were and the RSI has not given a sell signal. -The Fibonacci retracement levels of the fall from the high of Wave B to the low of Wave C. Note how Wave 3 of Wave I tested the 50% retracement level and corrected to the 38.2% retracement level. This suggests that the target for wave 5 of Wave I is 574.42, unless wave 5 rises in a pennant, when it could be higher. |

|
| FIGURE 1: S&P 100, WEEKLY |
| Graphic provided by: AdvancedGET. |
| |
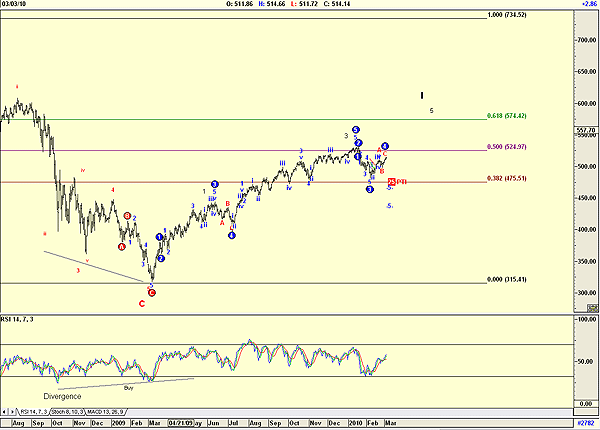
| Figure 2 is a daily chart of the S&P 100, with an Elliott wave count as suggested by the algorithms of the Advanced GET program. The chart does suggest a wave 5 lower, but the probability index (PTI) is 25. Any PTI less than 32 is a no-go. No matter how hard I try, I simply cannot see a double-dip recession happening. Yes, there will be a Wave II correction after Wave I, but it should only bring us back to present levels. |

|
| FIGURE 2: S&P 100, DAILY |
| Graphic provided by: AdvancedGET. |
| |
Has been a technical analyst since 1969, and has worked as a futures and options trader with First Financial Futures in Johannesburg, South Africa.
| Address: | 3256 West 24th Ave |
| Vancouver, BC | |
| Phone # for sales: | 6042634214 |
| E-mail address: | petroosp@gmail.com |
Click here for more information about our publications!
Comments
Date: 03/04/10Rank: 3Comment:

Request Information From Our Sponsors
- StockCharts.com, Inc.
- Candle Patterns
- Candlestick Charting Explained
- Intermarket Technical Analysis
- John Murphy on Chart Analysis
- John Murphy's Chart Pattern Recognition
- John Murphy's Market Message
- MurphyExplainsMarketAnalysis-Intermarket Analysis
- MurphyExplainsMarketAnalysis-Visual Analysis
- StockCharts.com
- Technical Analysis of the Financial Markets
- The Visual Investor
- VectorVest, Inc.
- Executive Premier Workshop
- One-Day Options Course
- OptionsPro
- Retirement Income Workshop
- Sure-Fire Trading Systems (VectorVest, Inc.)
- Trading as a Business Workshop
- VectorVest 7 EOD
- VectorVest 7 RealTime/IntraDay
- VectorVest AutoTester
- VectorVest Educational Services
- VectorVest OnLine
- VectorVest Options Analyzer
- VectorVest ProGraphics v6.0
- VectorVest ProTrader 7
- VectorVest RealTime Derby Tool
- VectorVest Simulator
- VectorVest Variator
- VectorVest Watchdog
