HOT TOPICS LIST
- MACD
- Fibonacci
- RSI
- Gann
- ADXR
- Stochastics
- Volume
- Triangles
- Futures
- Cycles
- Volatility
- ZIGZAG
- MESA
- Retracement
- Aroon
INDICATORS LIST
LIST OF TOPICS
PRINT THIS ARTICLE
by Austin Passamonte
The wedge formations that have developed on the charts for the oil indices are about ready to break.
Position: N/A
Austin Passamonte
Austin is a private trader who trades emini stock index futures intraday. He currently trades various futures markets from home in addition to managing a trader's educational forum
PRINT THIS ARTICLE
WEDGE FORMATIONS
Oil Is Coiled
12/06/01 11:35:42 AMby Austin Passamonte
The wedge formations that have developed on the charts for the oil indices are about ready to break.
Position: N/A
| The way oil prices have moved around recently one would think it was pork bellies of days gone by! Or more recently the NDX, but 1998 - early 2000 is gone forever we're sad to say. |
| Back to the point, fundamental market uncertainty in the patch has driven oil prices all over the map. A recent drop to prices below $20 barrel for crude have seen gasoline and heating oil follow suit. Is it game over for "black gold" in the foreseeable future? |

|
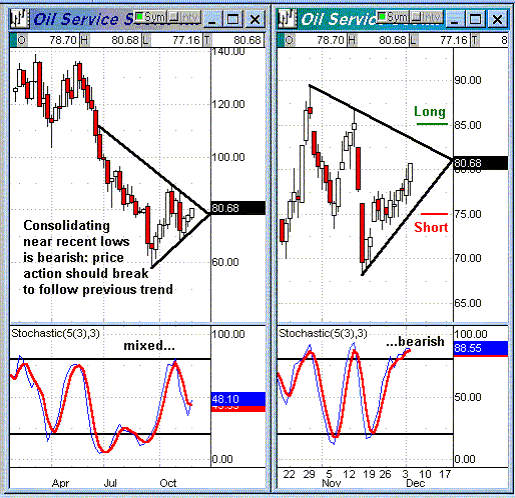
| Figure 1: Weekly/Daily Charts - OSX Oil Services Index |
| Graphic provided by: Quote.com. |
| Graphic provided by: QCharts. |
| |
| From this summer until now, Oil Services Index prices have been coiling themselves into a wedge. Which way it breaks remains anyone's guess, but a consolidation near recent lows can indeed be expected to continue the downtrend from here. Stochastic values are stuck right between oversold/overbought extremes and offer little guidance right now. Daily chart stochastic values are within overbought extreme and look rather weak at that. With price action two-thirds within the total wedge pattern formed, a break either way is imminent. We could consider going long or short underlying options (Jan 85 calls: OSX-AQ & Jan 75 puts: OSX-MO) on a break of the wedge either way. Schlumberger is also a main component of this index and would be an excellent proxy to game with shares or underlying options as well. |
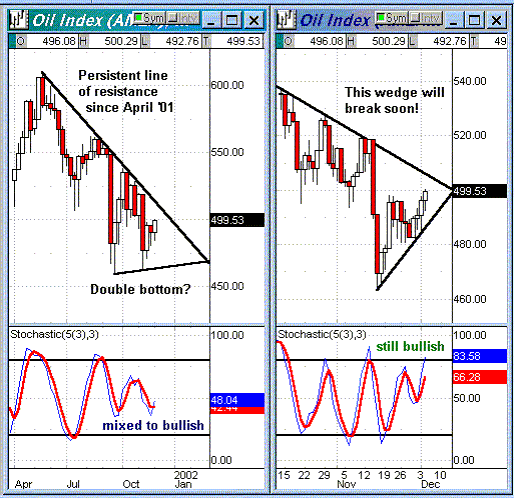
 Figure 2: Weekly/Daily Charts - XOI CBOE Oil Index Graphics courtesy of Qcharts @quote.com We see a similar, unclear pattern in oil stocks index as well. Wedges here are getting close to breaking and stochastic values remain bullish for now but incongruous across both time frames. A mutual alignment in one extreme or the other as price action nears one side of these wedges gives us a better than average guess on which direction lies next. That's the watch we're currently on. |
| Make no mistake: oil prices will soon flow strongly one way or the other. Opportunity to profit in stocks, equity or index options and/or futures contracts is setting up and the spigot will open when chart patterns break! |
Austin is a private trader who trades emini stock index futures intraday. He currently trades various futures markets from home in addition to managing a trader's educational forum
| Title: | Individual Trader |
| Company: | CoiledMarkets.com |
| Address: | PO Box 633 |
| Naples, NY 14512 | |
| Website: | coiledmarkets.com/blog |
| E-mail address: | austinp44@yahoo.com |
Traders' Resource Links | |
| CoiledMarkets.com has not added any product or service information to TRADERS' RESOURCE. | |
Click here for more information about our publications!
Comments
Date: 12/11/01Rank: 3Comment:
Date: 12/24/01Rank: 3Comment:

Request Information From Our Sponsors
- StockCharts.com, Inc.
- Candle Patterns
- Candlestick Charting Explained
- Intermarket Technical Analysis
- John Murphy on Chart Analysis
- John Murphy's Chart Pattern Recognition
- John Murphy's Market Message
- MurphyExplainsMarketAnalysis-Intermarket Analysis
- MurphyExplainsMarketAnalysis-Visual Analysis
- StockCharts.com
- Technical Analysis of the Financial Markets
- The Visual Investor
- VectorVest, Inc.
- Executive Premier Workshop
- One-Day Options Course
- OptionsPro
- Retirement Income Workshop
- Sure-Fire Trading Systems (VectorVest, Inc.)
- Trading as a Business Workshop
- VectorVest 7 EOD
- VectorVest 7 RealTime/IntraDay
- VectorVest AutoTester
- VectorVest Educational Services
- VectorVest OnLine
- VectorVest Options Analyzer
- VectorVest ProGraphics v6.0
- VectorVest ProTrader 7
- VectorVest RealTime Derby Tool
- VectorVest Simulator
- VectorVest Variator
- VectorVest Watchdog
