HOT TOPICS LIST
- MACD
- Fibonacci
- RSI
- Gann
- ADXR
- Stochastics
- Volume
- Triangles
- Futures
- Cycles
- Volatility
- ZIGZAG
- MESA
- Retracement
- Aroon
INDICATORS LIST
LIST OF TOPICS
PRINT THIS ARTICLE
by Chaitali Mohile
Wellpoint Health Network is undergoing a bearish consolidation. The breakdown is likely to open various trading opportunities.
Position: Sell
Chaitali Mohile
Active trader in the Indian stock markets since 2003 and a full-time writer. Trading is largely based upon technical analysis.
PRINT THIS ARTICLE
FLAGS AND PENNANTS
WLP Likely To Retrace
02/25/10 03:01:23 PMby Chaitali Mohile
Wellpoint Health Network is undergoing a bearish consolidation. The breakdown is likely to open various trading opportunities.
Position: Sell
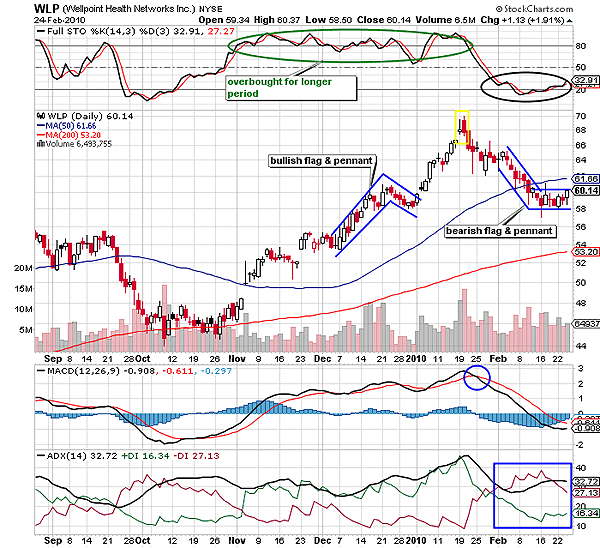
| Wellpoint Health Network (WLP) has descended from $70 to $60 in past weeks. The downside journey of WLP began with a shooting star candlestick pattern at the top as shown in Figure 1, followed by a huge bearish candle that engulfed the previous one. The shooting star is a bearish reversal formation, indicating the end of an existing uptrend. Subsequently, the overheated uptrend as reflected in the average directional movement index (ADX) (14) reversed, indicating the possibility of a trend reversal. In addition, the second bearish candle in the yellow box shows a bearish engulfing pattern. The shooting star is hugged by the bearish candle, and thus, the pattern reconfirmed that a fresh downtrend is under way. The full stochastic (14,3,3) was overbought for some time. Although traveling in an extreme bullish/bearish area is normal behavior for the oscillator, being in that area for an extended period of time will exhaust the strength/momentum of the rally and it will gradually reverse. Notice in Figure 1 that the stochastic also declined. The moving average convergence/divergence (MACD) (12,26,9) witnessed a bearish crossover (see the circled area) in positive territory. These confirm the downside rally. |

|
| FIGURE 1: WLP, DAILY. The bearish flag & pennant formation would hit the target of $53. |
| Graphic provided by: StockCharts.com. |
| |
| Thereafter, WLP dropped to $61, losing almost nine points from the top. The bearish hold on the rally stabilized as the 50-day moving average (MA) support was converted to resistance. The stock consolidated under the fresh resistance, forming a bearish flag & pennant continuation pattern on the daily time frame in Figure 1. Since WLP consolidated after a long declining rally, the pattern formed was the bearish flag & pennant. The ADX (14) shows a developed downtrend, and therefore, the breakout rally of the pattern would resume the existing declining rally. The earlier bullish consolidation range offered robust support to the current bearish rally, resulting in the bearish sideways movement. Therefore, undergoing the bearish rally would be something of a challenge for WLP. The stochastic (14,3,3) is ready to surge from an oversold area, but the developed downtrend and negative MACD (12,26,9) in Figure 1 would restrict the upward rally. In addition, WLP has an immediate resistance of 50-day MA. Thus, the stock is likely to remain range-bound. |
| Let us see the trading opportunities considering the bearish breakout and the support beneath. Traders can definitely strike a short position after the confirmed downside breakout of WLP. The minimum estimated level to be observed is 66-61 (length of the bearish rally) = 5. Subtract 5 from 58 (breakout level) and you end up with 53. At this level, you can also see the 200-day MA support at 53 levels. So the breakout rally is likely to pause at this level and bounce. The future upward rally from the 200-day MA would create fresh buying opportunities. But before initiating a long position, you should follow the indicator's signals as well. |

|
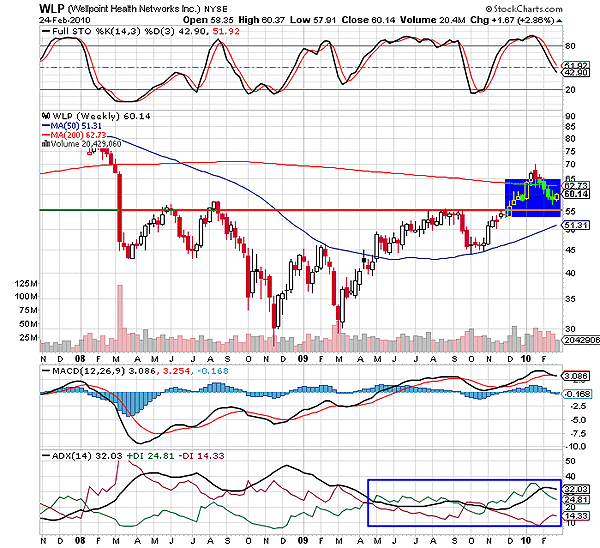
| FIGURE 2: WLP, WEEKLY. The support-resistance at 55 has the strength to change the direction of the price rally. The stock failed to sustain above the 200-day MA resistance and is likely to hit the next support at 55 levels. |
| Graphic provided by: StockCharts.com. |
| |
| Those interested in the long-term trading should refer to the weekly time frame. The support-resistance tool line in Figure 2 shows the strength existing at the 55 levels. In 2008, WLP had plunged to lower lows after hitting this resistance level. In 2009, though, the rally began on a strong bullish note; a double-bottom on the price chart, an ascending MACD (12,26,9), the declining downtrend of ADX (14), and the surging stochastic (14,3,3) in the overbought region all failed to violate resistance at the 55 level. The stock rushed to establish support at the 50-day MA. Eventually, WLP breached the resistance line in December 2009 and struggled to sustain above the 200-day MA resistance. But later, price drifted below the MA resistance. Therefore, the current corrective rally has the robust support of 55 levels followed by the 50-day MA. |
| Currently, the ADX (14) is descending from the well-developed uptrend area, the MACD (12,26,9) is zigzagging in positive territory, and the stochastic oscillator is slipping down in Figure 2. According to the weekly time frame, the long-term trend is bullish so the future upward rally from MA support is reliable. Hence, WLP would face volatility at the 55 level and drop further toward the next support. Thus, the big picture offers attractive trading opportunities for buyers as well as traders. |
Active trader in the Indian stock markets since 2003 and a full-time writer. Trading is largely based upon technical analysis.
| Company: | Independent |
| Address: | C1/3 Parth Indraprasth Towers. Vastrapur |
| Ahmedabad, Guj 380015 | |
| E-mail address: | chaitalimohile@yahoo.co.in |
Traders' Resource Links | |
| Independent has not added any product or service information to TRADERS' RESOURCE. | |
Click here for more information about our publications!
Comments
Date: 03/03/10Rank: 2Comment:

Request Information From Our Sponsors
- StockCharts.com, Inc.
- Candle Patterns
- Candlestick Charting Explained
- Intermarket Technical Analysis
- John Murphy on Chart Analysis
- John Murphy's Chart Pattern Recognition
- John Murphy's Market Message
- MurphyExplainsMarketAnalysis-Intermarket Analysis
- MurphyExplainsMarketAnalysis-Visual Analysis
- StockCharts.com
- Technical Analysis of the Financial Markets
- The Visual Investor
- VectorVest, Inc.
- Executive Premier Workshop
- One-Day Options Course
- OptionsPro
- Retirement Income Workshop
- Sure-Fire Trading Systems (VectorVest, Inc.)
- Trading as a Business Workshop
- VectorVest 7 EOD
- VectorVest 7 RealTime/IntraDay
- VectorVest AutoTester
- VectorVest Educational Services
- VectorVest OnLine
- VectorVest Options Analyzer
- VectorVest ProGraphics v6.0
- VectorVest ProTrader 7
- VectorVest RealTime Derby Tool
- VectorVest Simulator
- VectorVest Variator
- VectorVest Watchdog
