HOT TOPICS LIST
- MACD
- Fibonacci
- RSI
- Gann
- ADXR
- Stochastics
- Volume
- Triangles
- Futures
- Cycles
- Volatility
- ZIGZAG
- MESA
- Retracement
- Aroon
INDICATORS LIST
LIST OF TOPICS
PRINT THIS ARTICLE
by Alan R. Northam
The Broker/Dealer Index has a longstanding reputation as a stock market leader. In good times, the index leads the stock market higher, while in bad times it leads the stock market lower. These appear to be bad times.
Position: N/A
Alan R. Northam
Alan Northam lives in the Dallas, Texas area and as an electronic engineer gave him an analytical mind from which he has developed a thorough knowledge of stock market technical analysis. His abilities to analyze the future direction of the stock market has allowed him to successfully trade of his own portfolio over the last 30 years. Mr. Northam is now retired and trading the stock market full time. You can reach him at inquiry@tradersclassroom.com or by visiting his website at http://www.tradersclassroom.com. You can also follow him on Twitter @TradersClassrm.
PRINT THIS ARTICLE
REL. STR COMPARATIVE
IAI Leads Stock Market Lower
02/22/10 12:58:58 PMby Alan R. Northam
The Broker/Dealer Index has a longstanding reputation as a stock market leader. In good times, the index leads the stock market higher, while in bad times it leads the stock market lower. These appear to be bad times.
Position: N/A
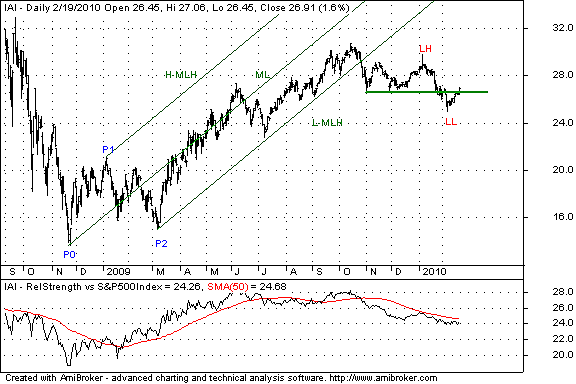
| The Broker/Dealer Index has a longstanding reputation as a leader of the stock market. Figure 1 shows the iShares Dow Jones US Broker/Dealer exchange traded fund (ETF)(IAI) to represent this index. According to Figure 1, IAI moved in an uptrend starting in early 2009. After forming its first three significant pivot points, I was able to draw the Andrews pitchfork to represent this upward trend. As can be seen, IAI moved up to the median line (ML) of the pitchfork until early June. In June to early July, IAI moved below the median line, finding support at the lower line of the pitchfork, labeled L-MLH. From July to October, IAI remained above the lower line of the pitchfork but never moved back up to the median line. This represented a show of weakening strength. In late October 2009, IAI finally broke down below the pitchfork to end the uptrend. |

|
| FIGURE 1: DAILY, IAI. Chart shows the price chart above and Andrews pitchfork and relative strength comparative chart below. |
| Graphic provided by: AmiBroker.com. |
| |
| The chart below the price chart of IAI in Figure 1 is a plot of relative strength. This plot is the result of dividing IAI by the Standard & Poor's 500. When the resulting plotted line moves upward, IAI is stronger than the S&P 500 and is said to be leading the S&P 500. From early to mid-2009, the relative strength line moved upward, indicating that the Broker/Dealer Index was leading the stock market higher. However, from midyear to October 2009, the line moved sideway, signaling weakness in the Broker/Dealer Index. Then from mid-October, the relative strength line started moving lower, signaling that the Broker/Dealer Index had become a stock market laggard, signaling trouble ahead for the stock market. I should note here that I have added a 50-day simple moving average to help with the visualization. |
| From October 2009 to today, IAI has continued to move lower, forming a lower high in January 2010 and a lower low in February, indicating that IAI is now in a downtrend. |
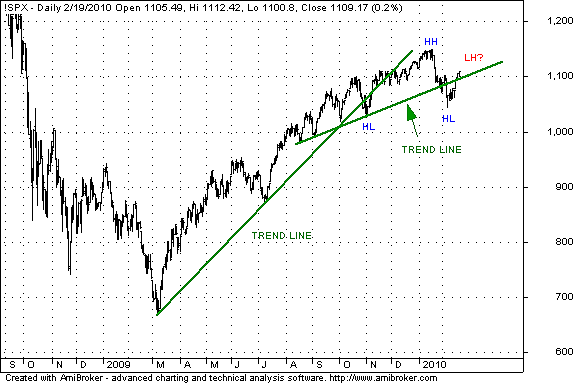
| While the Broker/Dealer ETF has become a market laggard, the S&P 500 continues upward, at least so far. Figure 2 shows a chart of the S&P 500 over this same time period. As can be seen from this figure, the S&P 500 moved upward along with IAI until late October, when it broke down below its major trendline at the same time that IAI lost its leadership role. From that time onward, the S&P 500 has managed to continue to push higher without the leadership of the Broker/Dealers. However, note that the S&Ps have been struggling to continue higher, as it has been forming a series of overlapping higher low and higher high waves. In January 2010, the S&P 500 finally broke down below its secondary trendline, signaling that it is becoming more difficult to continue to push higher. Recently, the S&P 500 has managed to break back above the trendline, but will it be able to make a new higher high, or will it fail and form its first lower high? Without the help from the Broker/Dealer Index, the higher probability is that the S&P 500 will fail to make a new higher high. |

|
| FIGURE 2: S&P 500, DAILY. Chart shows primary and secondary trendlines. |
| Graphic provided by: AmiBroker.com. |
| |
| In conclusion, the Broker/Dealer Index is known as a market leader. In good times it leads the stock market higher, and in bad times it leads the stock market lower. These appear to be the bad times. IAI is now in a downtrend, the S&P 500 is struggling to continue higher, and the relative strength index has turned downward. Now there is a high probability for the S&P 500 to turn downward as the Broker/Dealers continue to lead the broader stock market lower. |
Alan Northam lives in the Dallas, Texas area and as an electronic engineer gave him an analytical mind from which he has developed a thorough knowledge of stock market technical analysis. His abilities to analyze the future direction of the stock market has allowed him to successfully trade of his own portfolio over the last 30 years. Mr. Northam is now retired and trading the stock market full time. You can reach him at inquiry@tradersclassroom.com or by visiting his website at http://www.tradersclassroom.com. You can also follow him on Twitter @TradersClassrm.
| Garland, Tx | |
| Website: | www.tradersclassroom.com |
| E-mail address: | inquiry@tradersclassroom.com |
Click here for more information about our publications!
Comments
Date: 02/23/10Rank: 4Comment:

|

Request Information From Our Sponsors
- VectorVest, Inc.
- Executive Premier Workshop
- One-Day Options Course
- OptionsPro
- Retirement Income Workshop
- Sure-Fire Trading Systems (VectorVest, Inc.)
- Trading as a Business Workshop
- VectorVest 7 EOD
- VectorVest 7 RealTime/IntraDay
- VectorVest AutoTester
- VectorVest Educational Services
- VectorVest OnLine
- VectorVest Options Analyzer
- VectorVest ProGraphics v6.0
- VectorVest ProTrader 7
- VectorVest RealTime Derby Tool
- VectorVest Simulator
- VectorVest Variator
- VectorVest Watchdog
- StockCharts.com, Inc.
- Candle Patterns
- Candlestick Charting Explained
- Intermarket Technical Analysis
- John Murphy on Chart Analysis
- John Murphy's Chart Pattern Recognition
- John Murphy's Market Message
- MurphyExplainsMarketAnalysis-Intermarket Analysis
- MurphyExplainsMarketAnalysis-Visual Analysis
- StockCharts.com
- Technical Analysis of the Financial Markets
- The Visual Investor
