HOT TOPICS LIST
- MACD
- Fibonacci
- RSI
- Gann
- ADXR
- Stochastics
- Volume
- Triangles
- Futures
- Cycles
- Volatility
- ZIGZAG
- MESA
- Retracement
- Aroon
INDICATORS LIST
LIST OF TOPICS
PRINT THIS ARTICLE
by Alan R. Northam
By using the Fibonacci retracements and the Andrews pitchfork, a price and time relationship can be determined to forecast when a price target should be reached.
Position: N/A
Alan R. Northam
Alan Northam lives in the Dallas, Texas area and as an electronic engineer gave him an analytical mind from which he has developed a thorough knowledge of stock market technical analysis. His abilities to analyze the future direction of the stock market has allowed him to successfully trade of his own portfolio over the last 30 years. Mr. Northam is now retired and trading the stock market full time. You can reach him at inquiry@tradersclassroom.com or by visiting his website at http://www.tradersclassroom.com. You can also follow him on Twitter @TradersClassrm.
PRINT THIS ARTICLE
TECHNICAL ANALYSIS
Price And Time Targets
02/19/10 09:20:53 AMby Alan R. Northam
By using the Fibonacci retracements and the Andrews pitchfork, a price and time relationship can be determined to forecast when a price target should be reached.
Position: N/A
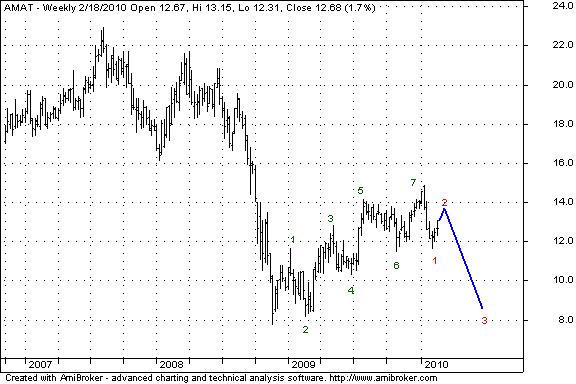
| Applied Materials Inc. (AMAT) formed a significant high pivot point in early August 2007 at $23 per share as shown in Figure 1. In late November 2008, AMAT made a significant low pivot point at $7.80 per share. From that time, AMAT has been moving higher in a series of overlapping waves. According to Elliott wave theory, overlapping waves are corrective waves. Thus, these overlapping waves indicate that AMAT has been undergoing a market correction over the last year. Elliott wave theory also states that seven overlapping waves fulfill the requirement for the completion of the market correction. If the market correction is now complete, then the latest low pivot point, labeled 1 in red on the chart, is the completion of the first wave in a new downtrend. Further, the upward rally over the last two weeks is the first correction in a new downward trend. In addition, if the current two-week-old rally is the first correction of a new downtrend, then the rally should form a new lower high as shown on the chart and labeled 2 in red. Following the completion of this wave 2 corrective rally, AMAT should then turn back down and start a significant selloff. The question is when this wave 2 corrective rally is expected to end. To help us determine the time and price at which AMAT is expected to reverse back down and start a significant selloff, Fibonacci retracements and the Andrews pitchfork can be used. |

|
| FIGURE 1: AMAT, WEEKLY. This chart shows the corrective Elliott waves. |
| Graphic provided by: AmiBroker.com. |
| |
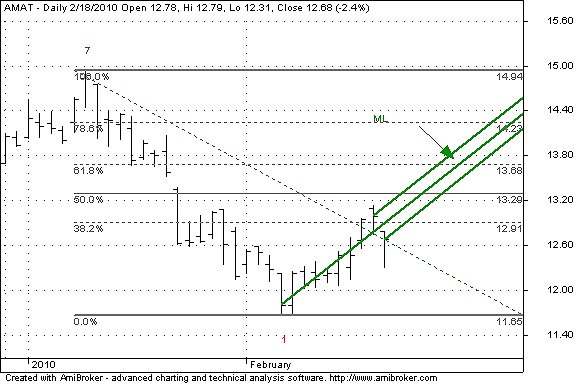
| In Figure 2, I have shown the daily chart of AMAT from the beginning of 2010. This chart shows the final wave 7 of the upward market correction from Figure 1 and the completion of the first wave down of the new downtrend, labeled wave 1 in red, also taken from Figure 1. In this chart, I have added the Fibonacci retracement levels. Wave 2 market corrections are normally deep corrections and normally end at about the 61.8% retracement of the previous wave. Therefore, Wave 2 of the new downtrend is expected to end at about $13.68 per share. Please note that the end of Wave 2 could also occur sooner at the 50% retracement level, but this is a lower probability. Thus, by using the Fibonacci retracement tool, a price target has been determined. Now all we need to do is define the time at which we expect price to hit our price target. To accomplish this, we will use the Andrews pitchfork. |

|
| FIGURE 2: AMAT, DAILY. This chart shows the Fibonacci retracement levels and the mini Andrews pitchfork. |
| Graphic provided by: AmiBroker.com. |
| |
| Figure 2 also shows the mini Andrews pitchfork. Alan Hall Andrews often used the mini pitchfork to determine a price target. Mini pitchforks are drawn using closing prices instead of highs and lows. Andrews recognized that price was often attracted to the median line of the pitchfork, labeled ML on the chart. Andrews also expected price to either reverse after moving up to the median line of the pitchfork or to continue to travel along it for a while before reversing directions. Thus, Andrews stated that the median line was a price area in which a reversal was expected to occur. In Figure 2, we should expect price to continue upward until it reaches the median line of the pitchfork. Price should then continue along the median line until it reaches the 61.8% Fibonacci retracment line. The crossover of the median line and the 61.8% retracment occurs on March 1. |
| There is one caveat I should make in regard to this analysis. Pitchforks are normally drawn off pivot points where the last bar on the chart may not be a pivot point, as it is yet unconfirmed. Therefore, if the market moves lower to form a new lower pivot point, the mini pitchfork will need to be redrawn, which will change the time that the median line is expected to cross the 61.8% Fibonacci retracement level. |
| In conclusion, by using the Fibonacci retracement price levels and the Andrews pitchfork, a price and time relationship can be determined to forecast when a price target is expected to be reached. In using this approach, it must be kept in mind that price normally reverses directions at the 38.2%, 50%, or 61.8% Fibonacci retracement levels. This then translates into differing times when the median line of the Andrews pitchfork will cross these Fibonacci retracement levels, and therefore, different times result when a reversal in price might occur. These price and time relationships are therefore areas of expected dates when a price target is to be reached and are not absolute. If price and time move through one target, then the analysis should shift to the next time and price relationship for the next target. |
Alan Northam lives in the Dallas, Texas area and as an electronic engineer gave him an analytical mind from which he has developed a thorough knowledge of stock market technical analysis. His abilities to analyze the future direction of the stock market has allowed him to successfully trade of his own portfolio over the last 30 years. Mr. Northam is now retired and trading the stock market full time. You can reach him at inquiry@tradersclassroom.com or by visiting his website at http://www.tradersclassroom.com. You can also follow him on Twitter @TradersClassrm.
| Garland, Tx | |
| Website: | www.tradersclassroom.com |
| E-mail address: | inquiry@tradersclassroom.com |
Click here for more information about our publications!
Comments
Date: 02/22/10Rank: 4Comment:

Request Information From Our Sponsors
- VectorVest, Inc.
- Executive Premier Workshop
- One-Day Options Course
- OptionsPro
- Retirement Income Workshop
- Sure-Fire Trading Systems (VectorVest, Inc.)
- Trading as a Business Workshop
- VectorVest 7 EOD
- VectorVest 7 RealTime/IntraDay
- VectorVest AutoTester
- VectorVest Educational Services
- VectorVest OnLine
- VectorVest Options Analyzer
- VectorVest ProGraphics v6.0
- VectorVest ProTrader 7
- VectorVest RealTime Derby Tool
- VectorVest Simulator
- VectorVest Variator
- VectorVest Watchdog
- StockCharts.com, Inc.
- Candle Patterns
- Candlestick Charting Explained
- Intermarket Technical Analysis
- John Murphy on Chart Analysis
- John Murphy's Chart Pattern Recognition
- John Murphy's Market Message
- MurphyExplainsMarketAnalysis-Intermarket Analysis
- MurphyExplainsMarketAnalysis-Visual Analysis
- StockCharts.com
- Technical Analysis of the Financial Markets
- The Visual Investor
