HOT TOPICS LIST
- MACD
- Fibonacci
- RSI
- Gann
- ADXR
- Stochastics
- Volume
- Triangles
- Futures
- Cycles
- Volatility
- ZIGZAG
- MESA
- Retracement
- Aroon
INDICATORS LIST
LIST OF TOPICS
PRINT THIS ARTICLE
by Ron Walker
Identifying price shifts in the market at the earliest possible moment can lead to big profits and allow you to trade in the direction of the trend. By using the 1-2-3 trend reversal methodology, we can confidently know the exact moment a trend changes.
Position: N/A
Ron Walker
Ron Walker is an active trader and technical analyst. He operates an educational website dedicated to the study of Technical Analysis. The website offers free market analysis with daily video presentations and written commentaries. Ron is a video pioneer, being one of the first to utilize the internet producing Technical Analysis videos. His website is thechartpatterntrader.com
PRINT THIS ARTICLE
REVERSAL
Will A 1-2-3 Trend Reversal Mark The Top For The S&P 500?
02/19/10 12:26:46 PMby Ron Walker
Identifying price shifts in the market at the earliest possible moment can lead to big profits and allow you to trade in the direction of the trend. By using the 1-2-3 trend reversal methodology, we can confidently know the exact moment a trend changes.
Position: N/A
| One of the most certain ways of knowing if a trend is truly changing is described in Victor Sperandeo's book Methods Of A Wall Street Master. Sperandeo contends that in order for a change in trend to occur, three important changes in price movement must take place, which he has nicknamed the 1-2-3 trend reversal. Each of the numbers refer to a specific stage in the trend reversal pattern. For instance, the "1" represents the initial break in a trend. The "2" refers to a test back to the preceding high or low as the previous trend tries to reassert itself. If prices cannot move beyond the previous high or low, it opens the door for stage 3. The third stage of 1-2-3 trend reversal occurs the moment prices move beyond the low (in the case of a previous uptrend) or high (in the case of a previous downtrend) that occurred after the initial trend break was established. All three stages must be completed in order to properly identify a change in trend. |

|
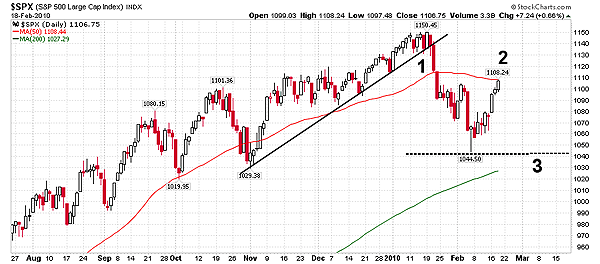
| FIGURE 1: $SPX, DAILY. Here we see a potential 1-2-3 trend reversal. Prices may reverse off the 50-day MA to complete stage 2 of the pattern if the bulls fail to reestablish the previous trend. If prices complete stage 3, a lower high and lower low will establish an new downtrend. |
| Graphic provided by: StockCharts.com. |
| |
| In Figure 1, the daily chart of the Standard & Poor's 500 reveals that prices have already crossed below the trendline in mid-January. This trendline is actually taken from the March 2009 low, but I have magnified the chart so we can concentrate on the current price behavior. Following the trend break, the bears aggressively pushed the S&P 500 down to 1044, completing the first stage of the 1-2-3 pattern. After finding a short-term bottom in early February, stage 2 began with a powerful rally back to the 50-day moving average (MA) to test the January high (Figure 1). Currently, prices have halted right at the 50-day MA, hesitating to move above. The reluctance to clear it well may bring another epidemic of selling. This rally will live or die on its ability to move above the 50-day moving average. Failure to do so will result in irreconcilable damage to this recovery attempt. The 50-day is a powerful point of resistance and will likely bring back sellers. Now, in order for stage 2 to be completed and for a downtrend to begin, prices have to stop making higher highs and establish a lower high. Then they must turn back down and move below the 1044 minor low that occurred after the initial trend break. By speculating on a 1-2-3 trend reversal, we're looking for a price pop to the 50-day MA and then a drop back to the 200-day MA where support lies, thus completing phase 3 of the pattern. |

|
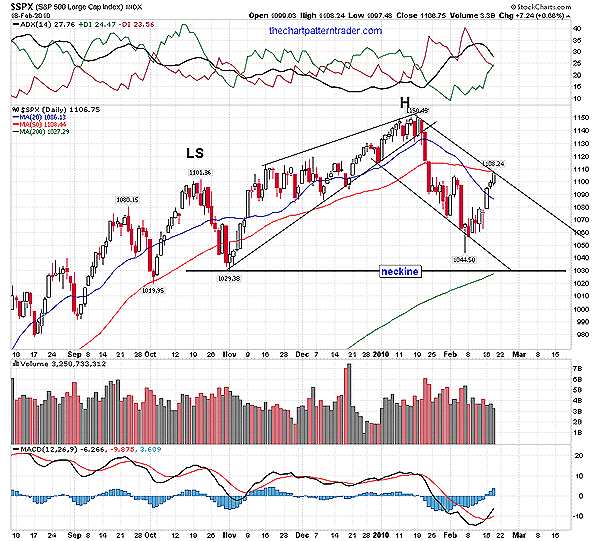
| FIGURE 2: $SPX, DAILY. If prices reverse at the 50-day MA and drop, they will likely test the neckline and 200-day MA in order to complete the head of a potential head & shoulders topping pattern. |
| Graphic provided by: StockCharts.com. |
| |
| In addition to the 1-2-3 setup in play, the S&P 500 also has a head & shoulders topping pattern carving out (Figure 2). If prices drop down to the neckline (near 1030) of the head & shoulders pattern and tag the 200-day MA, the head will be completed. Currently, the 200-day MA is hovering near the neckline on the S&P 500. Failure for prices to move back above the 50-day MA, will only increase the bearish stronghold surrounding the 50-day MA. In Figure 2, we can see that a 10% correction on the S&P 500 would be at 1035, which is very close to the 1030 neckline. Once the S&P 500 has tested the 200-day MA, prices should rally up one last time to form the right shoulder and complete the pattern. |

|
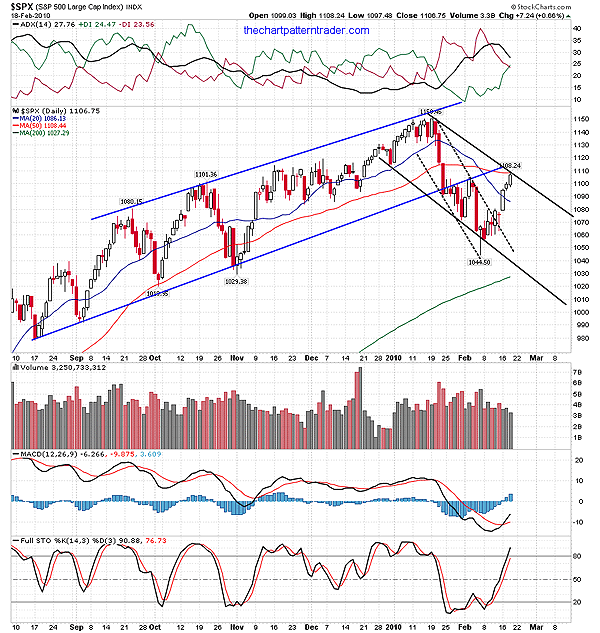
| FIGURE 3: $SPX, DAILY. After prices peaked in the rising channel, they sharply declined until early February, forming a very steep falling price channel (dotted black lines). Prices then broke out of that channel, evolving into a less abrupt, more gradual incline (solid black lines). |
| Graphic provided by: StockCharts.com. |
| |
| Given that bearish scenario, this current countertrend is likely nothing more than a charade, a pseudo rally forming so that the S&P 500 can expand its current channel. Figure 3 showcases several channels on the S&P 500 daily chart. Note that immediately following the January high at 1150, prices rapidly declined, forming a very steep falling price channel (marked with black dotted lines) that was unsustainable. Therefore, it was necessary for prices to rally higher in order to expand into a larger price channel that didn't have such a steep slope before beginning the next leg down. |
| Assuming that the 1-2-3 pattern is successful, we can speculate the measurement of the pattern using the swing rule. By taking the difference between the January high and February low that completed phase 1, we find a measurement of 106 points. By subtracting that amount from the February low of 1044, we get an objective target of 938. Should the S&P 500 reach that target, it would result in a correction of approximately 18.50%. Ironically, the head & shoulders pattern measures down 120 points to 910, very close to that price target, which would amount to a 20% correction. Finally, looking back to Figure 1, we can conclude that a move above 1150 would be construed as bullish, while a move below the last minor low of 1044 would be quite bearish and signal a new downtrend, completing a 1-2-3 trend reversal. |
Ron Walker is an active trader and technical analyst. He operates an educational website dedicated to the study of Technical Analysis. The website offers free market analysis with daily video presentations and written commentaries. Ron is a video pioneer, being one of the first to utilize the internet producing Technical Analysis videos. His website is thechartpatterntrader.com
| Website: | thechartpatterntrader.com |
| E-mail address: | thechartpatterntrader@gmail.com |
Click here for more information about our publications!
Comments
Date: 02/22/10Rank: 3Comment:

Request Information From Our Sponsors
- StockCharts.com, Inc.
- Candle Patterns
- Candlestick Charting Explained
- Intermarket Technical Analysis
- John Murphy on Chart Analysis
- John Murphy's Chart Pattern Recognition
- John Murphy's Market Message
- MurphyExplainsMarketAnalysis-Intermarket Analysis
- MurphyExplainsMarketAnalysis-Visual Analysis
- StockCharts.com
- Technical Analysis of the Financial Markets
- The Visual Investor
- VectorVest, Inc.
- Executive Premier Workshop
- One-Day Options Course
- OptionsPro
- Retirement Income Workshop
- Sure-Fire Trading Systems (VectorVest, Inc.)
- Trading as a Business Workshop
- VectorVest 7 EOD
- VectorVest 7 RealTime/IntraDay
- VectorVest AutoTester
- VectorVest Educational Services
- VectorVest OnLine
- VectorVest Options Analyzer
- VectorVest ProGraphics v6.0
- VectorVest ProTrader 7
- VectorVest RealTime Derby Tool
- VectorVest Simulator
- VectorVest Variator
- VectorVest Watchdog
