HOT TOPICS LIST
- MACD
- Fibonacci
- RSI
- Gann
- ADXR
- Stochastics
- Volume
- Triangles
- Futures
- Cycles
- Volatility
- ZIGZAG
- MESA
- Retracement
- Aroon
INDICATORS LIST
LIST OF TOPICS
PRINT THIS ARTICLE
by Chaitali Mohile
The Russell 2000 i-Shares has gained a few points in the current rally. Will the upward movement continue and open one more buy setup?
Position: Buy
Chaitali Mohile
Active trader in the Indian stock markets since 2003 and a full-time writer. Trading is largely based upon technical analysis.
PRINT THIS ARTICLE
SUPPORT & RESISTANCE
IWM On Bullish Track?
02/19/10 10:38:05 AMby Chaitali Mohile
The Russell 2000 i-Shares has gained a few points in the current rally. Will the upward movement continue and open one more buy setup?
Position: Buy
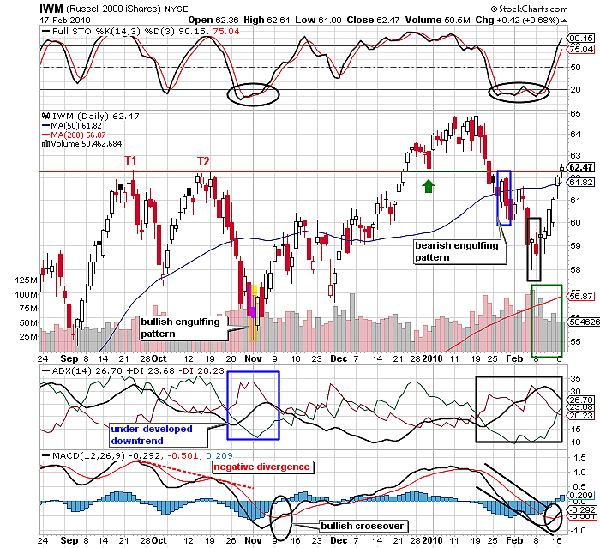
| From Figure 1 you can see how the Russell 200 i-Shares (IWM) reacted to the $62 support-resistance level. In Figure 1, IWM faced robust resistance at this level, forming a very short-term double top in mid-September and October 2009. T1 and T2 are marked to show the double-top formation. The short-term bearish reversal formation on the price chart and a negative divergence of the moving average convergence/divergence (MACD) (12,26,9) resulted in a bearish breakout, plunging IWM to the previous low at $55. Later, the bullish engulfing candlestick pattern, an underdeveloped downtrend, a bullish crossover of the MACD (12,26,9), and an oversold full stochastic (14,3,3) all suggested a robust bullish rally under way. |
| IWM initiated a fresh rally with robust strength and gradually violated the 50-day moving average (MA) resistance. However, the average directional movement index (ADX) (14) failed to surge above the 20 levels with sufficient buying pressure to develop an uptrend. As a result, the 50-day MA breakout rally in Figure 1 turned pretty volatile. The stochastic oscillator retraced to the support level at 50 before shifting into an overbought zone. The snaky movement of the MACD (12,26,9) also indicated the volatility during the MA breakout. IWM continued to surge reluctantly in uncertain and volatile scenario. Later, the robust resistance at 62 levels was hit in a similar scenario. The support-resistance tool line is used to highlight this crucial area. IWM in Figure 1 retraced to challenge the newly converted support line (see the green arrow) and resumed its journey. |

|
| FIGURE 1: IWM, DAILY |
| Graphic provided by: StockCharts.com. |
| |
| Meanwhile, the overbought stochastic underwent shaky movement, signifying lack of bullish momentum to drag the bullish rally ahead (65 levels). On these notes, IWM was unable to sustain above the support-resistance line at 62 levels, and price retraced back to the line in Figure 1. The declining price action weakened further indicated by the bearish engulfing candlestick pattern in the same area. Although the full stochastic (14,3,3) was highly oversold below the 20 level, the bearish force in the resistance line was robust, drifting the price lower to 58 levels. This entire picture pinpoints the strength of 62 levels as a resistance and also as support for IWM. |
| The important point note here is that a pullback rally of IWM from 58 levels is back to the same support-resistance zone. A small hammer and an inverted hammer marked in black rectangle in Figure 1 began the relief rally and touched the resistance line. The ADX (14) that indicated a developing bearish trend reversed, confirming the candlestick patterns. Thus, the bulls tried their hands on the rally and pulled IWM higher. The long white candles reflect the bullish strength. In addition, the candles closed near the respective days' highs, indicating the positive intention to drag IWM at the previous high. Since the buying pressure is picking up in the ADX (14) in Figure 1, an uptrend seems under way. The stochastic (14,3,3) is moving vertically upward in the highly overbought area. In addition, a bullish crossover of the MACD (12,26,9) is likely to generate bullish sentiments in the current rally. Thus, everything together shows significant strength in the price action and would breach the resistance line at 62 levels. The increased volume confirms the stability of the rally. |
| The breakout would be confirmed only if IWM opens above the freshly formed support at 62 levels in the following trading session. This would be one of the short-term entry points for buyers with a target of the prior high pivot at 65 levels. |
Active trader in the Indian stock markets since 2003 and a full-time writer. Trading is largely based upon technical analysis.
| Company: | Independent |
| Address: | C1/3 Parth Indraprasth Towers. Vastrapur |
| Ahmedabad, Guj 380015 | |
| E-mail address: | chaitalimohile@yahoo.co.in |
Traders' Resource Links | |
| Independent has not added any product or service information to TRADERS' RESOURCE. | |
Click here for more information about our publications!
Comments
Date: 02/22/10Rank: 2Comment:

Request Information From Our Sponsors
- StockCharts.com, Inc.
- Candle Patterns
- Candlestick Charting Explained
- Intermarket Technical Analysis
- John Murphy on Chart Analysis
- John Murphy's Chart Pattern Recognition
- John Murphy's Market Message
- MurphyExplainsMarketAnalysis-Intermarket Analysis
- MurphyExplainsMarketAnalysis-Visual Analysis
- StockCharts.com
- Technical Analysis of the Financial Markets
- The Visual Investor
- VectorVest, Inc.
- Executive Premier Workshop
- One-Day Options Course
- OptionsPro
- Retirement Income Workshop
- Sure-Fire Trading Systems (VectorVest, Inc.)
- Trading as a Business Workshop
- VectorVest 7 EOD
- VectorVest 7 RealTime/IntraDay
- VectorVest AutoTester
- VectorVest Educational Services
- VectorVest OnLine
- VectorVest Options Analyzer
- VectorVest ProGraphics v6.0
- VectorVest ProTrader 7
- VectorVest RealTime Derby Tool
- VectorVest Simulator
- VectorVest Variator
- VectorVest Watchdog
