HOT TOPICS LIST
- MACD
- Fibonacci
- RSI
- Gann
- ADXR
- Stochastics
- Volume
- Triangles
- Futures
- Cycles
- Volatility
- ZIGZAG
- MESA
- Retracement
- Aroon
INDICATORS LIST
LIST OF TOPICS
PRINT THIS ARTICLE
by Chaitali Mohile
The Dow Jones Utility Average severely lost bullish strength in the past correction. The charts suggest that a gaining season for the index is under way.
Position: Buy
Chaitali Mohile
Active trader in the Indian stock markets since 2003 and a full-time writer. Trading is largely based upon technical analysis.
PRINT THIS ARTICLE
TECHNICAL ANALYSIS
Correction Phase Of Utility Average Ends
02/18/10 12:37:22 PMby Chaitali Mohile
The Dow Jones Utility Average severely lost bullish strength in the past correction. The charts suggest that a gaining season for the index is under way.
Position: Buy
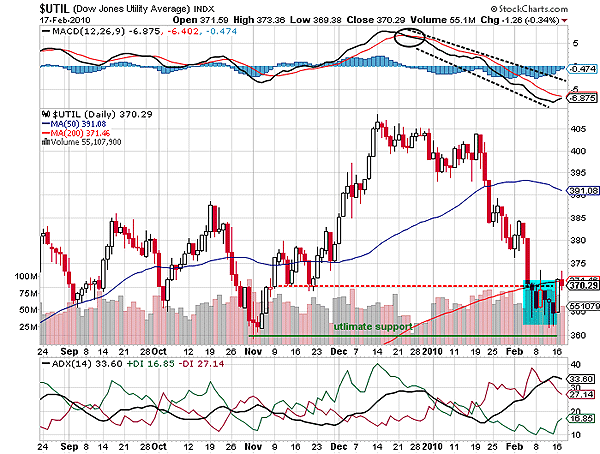
| According to the daily time frame, the Dow Jones Utility Average ($UTIL) began its bullish journey in November 2009 from the low at about the 359 levels. After violating the 50-day moving average (MA) resistance, the upward move gained robust strength and reached the new high at 405 levels. However, the technical indicators could not sustain in the bullish region. The average directional movement index (ADX) (14) hardly reached the 30 levels. Although the positive directional index (+DI) of the trend indicator in Figure 1 shows huge buying pressure, an uptrend failed to surge in a well-developed area above 30 levels. The moving average convergence/divergence (MACD) (12,26,9) turned negative by slipping below the trigger line. The bearish crossover of the indicators shows the possibility of bearish momentum. This explains the bearish rally in $UTIL. |

|
| FIGURE 1: $UTIL, DAILY. The bullish breakout would be confirmed if the index opens above the red dotted resistance line. |
| Graphic provided by: StockCharts.com. |
| |
| By early February 2010, the index lost all its gain from the previous bullish rally. We can see $UTIL is back at the 365 levels. The blue block shows a cluster of bearish candles with the long lower shadows and a bullish candle with a long upper shadow. Among these candles are the two hammers, one with a bullish real body and another with a bearish body (formed on February 12 and 15, respectively). If we consider the entire cluster of candles, then $UTIL seems to bottom out near the immediate support at 359.33 levels, and if we decided to watch just the hammer candles in the block, we can still anticipate a future bullish rally. The index has established support just a few points away from the previous low at 359.33 levels, so we can consider it to be a double-bottom formation. |
| The double-bottom bullish reversal formation is likely to initiate the fresh rally from current levels. The red dotted lines are marked to show the previous consolidation range that is likely to restrict the future bullish rally. Therefore, a fresh long position can be set above this level. Currently, the ADX (14) is tipping down, suggesting the declining downtrend, and the MACD (12,26,9) has yet to surge above the trigger line in negative territory. Thus, we need to wait for the confirmed bullish breakout. |

|
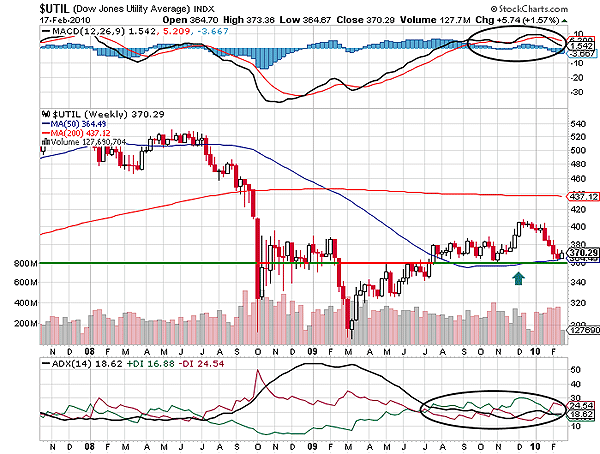
| FIGURE 2: $UTIL, WEEKLY. The index has established strong support at the 50-day MA near 360 levels. |
| Graphic provided by: StockCharts.com. |
| |
| On the weekly time frame in Figure 2, $UTIL has two major supports: first, the 50-day MA support and second, the support-resistance area created by the previous highs and lows. The ADX (14) shows the possibility of consolidation for the index, and the MACD (12,26,9) is volatile in positive territory. Therefore, $UTIL is likely to recover slowly in the long term. Although support has been established, the technical indicators are not completely bullish. |
| Considering both technical charts, $UTIL is likely to pull back. |
Active trader in the Indian stock markets since 2003 and a full-time writer. Trading is largely based upon technical analysis.
| Company: | Independent |
| Address: | C1/3 Parth Indraprasth Towers. Vastrapur |
| Ahmedabad, Guj 380015 | |
| E-mail address: | chaitalimohile@yahoo.co.in |
Traders' Resource Links | |
| Independent has not added any product or service information to TRADERS' RESOURCE. | |
Click here for more information about our publications!
Comments
Date: 02/18/10Rank: 5Comment:
Date: 02/19/10Rank: 3Comment:

Request Information From Our Sponsors
- StockCharts.com, Inc.
- Candle Patterns
- Candlestick Charting Explained
- Intermarket Technical Analysis
- John Murphy on Chart Analysis
- John Murphy's Chart Pattern Recognition
- John Murphy's Market Message
- MurphyExplainsMarketAnalysis-Intermarket Analysis
- MurphyExplainsMarketAnalysis-Visual Analysis
- StockCharts.com
- Technical Analysis of the Financial Markets
- The Visual Investor
- VectorVest, Inc.
- Executive Premier Workshop
- One-Day Options Course
- OptionsPro
- Retirement Income Workshop
- Sure-Fire Trading Systems (VectorVest, Inc.)
- Trading as a Business Workshop
- VectorVest 7 EOD
- VectorVest 7 RealTime/IntraDay
- VectorVest AutoTester
- VectorVest Educational Services
- VectorVest OnLine
- VectorVest Options Analyzer
- VectorVest ProGraphics v6.0
- VectorVest ProTrader 7
- VectorVest RealTime Derby Tool
- VectorVest Simulator
- VectorVest Variator
- VectorVest Watchdog
