HOT TOPICS LIST
- MACD
- Fibonacci
- RSI
- Gann
- ADXR
- Stochastics
- Volume
- Triangles
- Futures
- Cycles
- Volatility
- ZIGZAG
- MESA
- Retracement
- Aroon
INDICATORS LIST
LIST OF TOPICS
PRINT THIS ARTICLE
by Alan R. Northam
SMH has now reversed from an uptrend to a downtrend. By using the Andrews pitchfork, the price level at which a new lower high price will form can be determined as well as the slope of the new downward trend. In addition, by using the pitchfork it can be determined when price starts to accelerate to the downside.
Position: N/A
Alan R. Northam
Alan Northam lives in the Dallas, Texas area and as an electronic engineer gave him an analytical mind from which he has developed a thorough knowledge of stock market technical analysis. His abilities to analyze the future direction of the stock market has allowed him to successfully trade of his own portfolio over the last 30 years. Mr. Northam is now retired and trading the stock market full time. You can reach him at inquiry@tradersclassroom.com or by visiting his website at http://www.tradersclassroom.com. You can also follow him on Twitter @TradersClassrm.
PRINT THIS ARTICLE
ANDREWS PITCH-FORK
SMH In Downtrend
02/18/10 09:04:23 AMby Alan R. Northam
SMH has now reversed from an uptrend to a downtrend. By using the Andrews pitchfork, the price level at which a new lower high price will form can be determined as well as the slope of the new downward trend. In addition, by using the pitchfork it can be determined when price starts to accelerate to the downside.
Position: N/A
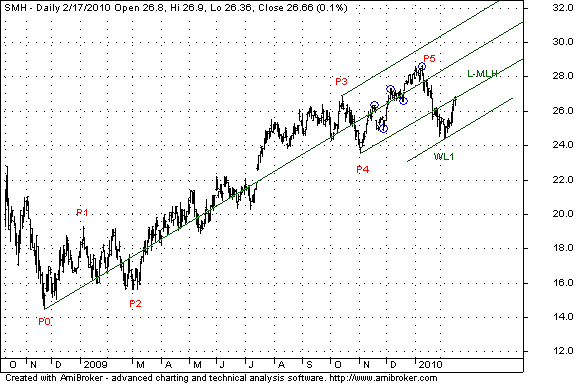
| In the January 19, 2010, Traders.com Advantage article entitled "Semiconductors Reverse Trend," I described how an expected reversal in trend could be determined using Alan Hall Andrews' pitchfork and other technical analysis methods he developed. Figure 1 shows that the Semiconductor HOLDRS exchange traded fund (ETF)(SMH) did reverse directions from up to down by breaking down below the lower horizontal line of the pitchfork labeled L-MLH as expected. Once the pitchfork is broken and it is determined that a trend reversal has occurred, Alan Andrews would draw a warning line on the chart. I have also added such a line to the chart and is labeled WL1. A warning line is drawn parallel to the median line (ML) of the pitchfork and is projected downward below the lower line of the pitchfork by the distance from the median line to the lower horizontal line of the pitchfork. Andrews used horizontal instead of parallel when describing that the upper and lower lines of the pitchfork were parallel to the median line. A warning line was a price area in which price was expected to reverse back upward. So once it had been determined that a new downtrend was under way, the warning line then warned traders of an area of a possible reversal back to the upside, hence the name "warning line." From Figure 1, it can be seen that SMH did reverse back upward once it reached the warning line. In some cases, price would continue lower through the warning line. Under these circumstances, a second warning line would be drawn. |

|
| FIGURE 1: SMH, DAILY. Here are the Andrews pitchfork and warning line 1. |
| Graphic provided by: AmiBroker.com. |
| |
| Price has now moved back up to the lower horizontal line (L-MLH) of the pitchfork. When price is above this horizontal line, the L-MLH acts as a line of support; however, once price breaks down below the L-MLH, it acts as overhead resistance just like a regular support line changes from support to resistance when price breaks down below them. Since the L-MLH now acts as resistance, it is expected that price will continue to follow the lower horizontal line of the pitchfork higher or reverse back downward. |
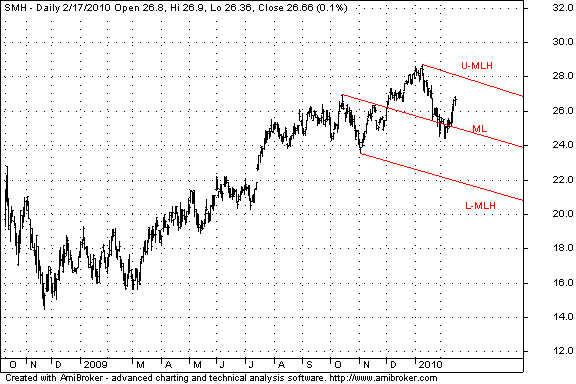
| Since SMH has now officially reversed downward, a significant pivot point, P5, has been formed. After the completion of a significant pivot point, Andrews would draw a new pitchfork off the last three significant pivot points. This is shown in Figure 2. From the previous article mentioned, I made note that Andrews recognized that 80% of the time, price would move down to the median line of the new pitchfork and then reverse back upward. Figure 2 shows that this is exactly what has happened. After forming the significant pivot point P5, a new pitchfork was drawn off the last three significant pivot points and price moved down to the median line of the new pitchfork and reversed back upward. It is now expected that price will move upward to the upper horizontal line (U-MLH) of the new pitchfork and reverse back downward. This will then form a new lower high, verifying that a new downward trend is under way. A failure to reach the upper horizontal line of the pitchfork before reversing downward will indicate a price failure. Andrews recognized that a price failure often signaled that the next downward leg would be more severe than the previous downward leg. |

|
| FIGURE 2: SMH, DAILY. Here's the bearish pitchfork. |
| Graphic provided by: AmiBroker.com. |
| |
| In conclusion, SMH has now reversed downward and a new downsloping pitchfork has been formed. The price is now expected to move lower along the median line of the pitchfork. However, a breakdown below the lower horizontal line (L-MLH) of the pitchfork would signal that price is accelerating to the downside. |
Alan Northam lives in the Dallas, Texas area and as an electronic engineer gave him an analytical mind from which he has developed a thorough knowledge of stock market technical analysis. His abilities to analyze the future direction of the stock market has allowed him to successfully trade of his own portfolio over the last 30 years. Mr. Northam is now retired and trading the stock market full time. You can reach him at inquiry@tradersclassroom.com or by visiting his website at http://www.tradersclassroom.com. You can also follow him on Twitter @TradersClassrm.
| Garland, Tx | |
| Website: | www.tradersclassroom.com |
| E-mail address: | inquiry@tradersclassroom.com |
Click here for more information about our publications!
Comments
Date: 02/19/10Rank: 3Comment:

Request Information From Our Sponsors
- StockCharts.com, Inc.
- Candle Patterns
- Candlestick Charting Explained
- Intermarket Technical Analysis
- John Murphy on Chart Analysis
- John Murphy's Chart Pattern Recognition
- John Murphy's Market Message
- MurphyExplainsMarketAnalysis-Intermarket Analysis
- MurphyExplainsMarketAnalysis-Visual Analysis
- StockCharts.com
- Technical Analysis of the Financial Markets
- The Visual Investor
- VectorVest, Inc.
- Executive Premier Workshop
- One-Day Options Course
- OptionsPro
- Retirement Income Workshop
- Sure-Fire Trading Systems (VectorVest, Inc.)
- Trading as a Business Workshop
- VectorVest 7 EOD
- VectorVest 7 RealTime/IntraDay
- VectorVest AutoTester
- VectorVest Educational Services
- VectorVest OnLine
- VectorVest Options Analyzer
- VectorVest ProGraphics v6.0
- VectorVest ProTrader 7
- VectorVest RealTime Derby Tool
- VectorVest Simulator
- VectorVest Variator
- VectorVest Watchdog
