HOT TOPICS LIST
- MACD
- Fibonacci
- RSI
- Gann
- ADXR
- Stochastics
- Volume
- Triangles
- Futures
- Cycles
- Volatility
- ZIGZAG
- MESA
- Retracement
- Aroon
INDICATORS LIST
LIST OF TOPICS
PRINT THIS ARTICLE
by Koos van der Merwe
Albert Einstein said that energy cannot be created or destroyed. The energy we use in our everyday life must therefore be released from wherever it is confined, whether it is in oil, or atoms. Right?
Position: Accumulate
Koos van der Merwe
Has been a technical analyst since 1969, and has worked as a futures and options trader with First Financial Futures in Johannesburg, South Africa.
PRINT THIS ARTICLE
OSCILLATOR CROSS
Suncor Energy Heats Up
02/18/10 08:53:24 AMby Koos van der Merwe
Albert Einstein said that energy cannot be created or destroyed. The energy we use in our everyday life must therefore be released from wherever it is confined, whether it is in oil, or atoms. Right?
Position: Accumulate
| It will take at least 10 years for the nuclear power stations that President Obama has stated will be built in the US. It will take who knows how many years before all the automobiles in the world will no longer use petroleum or ethanol, but electricity... which will be generated by... who knows what. Until then it is oil..Oil...OIL, and of course methane gas. Suncor Energy, which is listed on the Toronto Stock Exchange, is a company that pioneered the commercial development of Canada's Athabasca oil sands — one of the world's largest petroleum resource basins. Since then, Suncor has grown to become globally competitive, with a balanced portfolio of high-quality assets, a strong balance sheet, and significant growth prospects. It offers: -Near Fort McMurray, in Alberta, Canada, Suncor extracts and upgrades oil sands into high-quality, refinery-ready crude oil products and diesel fuel. -In Western Canada, Suncor explores for, develops, and produces natural gas. -The international and offshore business focuses on operations in the North Sea (United Kingdom, Netherlands, and Norway) and the East Coast of Canada (where it participates in every major oil development project). Suncor is also building material positions in the growth areas of Libya, Syria and Trinidad and Tobago. -Across Canada and Colorado, Suncor's downstream operations market the company's refined products to industrial, commercial, and retail customers. They have refineries in Edmonton, Alberta, Sarnia, Ontario, Montreal, Quebec and Commerce City, CO. Suncor is also investing in clean, renewable energy sources. -Suncor has four windpower farms in operation. With a total capacity of 147 megawatts, these renewable energy sites serve as an alternative to hydrocarbon-fuelled generation. -Suncor's ethanol facility located in the township of St. Clair, Ontario, has a current production capacity of 200 million liters per year. The ethanol is blended into the company's Sunoco and Phillips 66-branded gasoline and contributes to CO2 emission reductions of up to 300,000 tonnes per year. What do the charts tell us? |

|
| FIGURE 1: SUNCOR, WEEKLY |
| Graphic provided by: MetaStock. |
| |
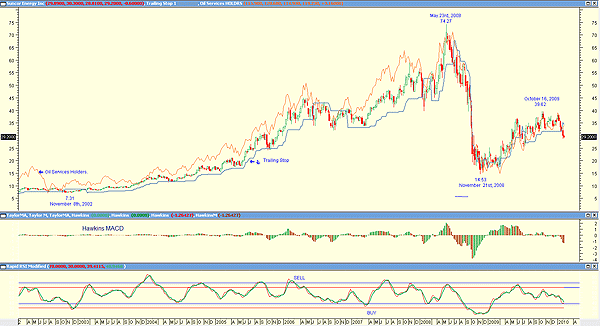
| Figure 1 is weekly and shows how the price rose from a low of $7.31 on November 8, 2002, to a high of $74.27 by May 23, 2008. This movement was caused by a combination of the oil price bubble and growth in the company. When the bubble burst, the price dropped to a low of $14.53 by November 21, 2008. Since then, it has risen to a high of $39.62 by October 16, 2009, as the price of oil rose and it is currently trading at the $29.20 range. On the chart, I have included oil services HOLDRS to show how the oil price is moving and how closely the Suncor Energy price is following it. The indicators shown on the chart are the Hawkins moving average convergence/divergence (MACD) and the rapid relative strength index (RSI) modified. Both are suggesting further downside, although a bottom does appear close at hand. |

|
| FIGURE 2: SUNCOR, DAILY |
| Graphic provided by: MetaStock. |
| |
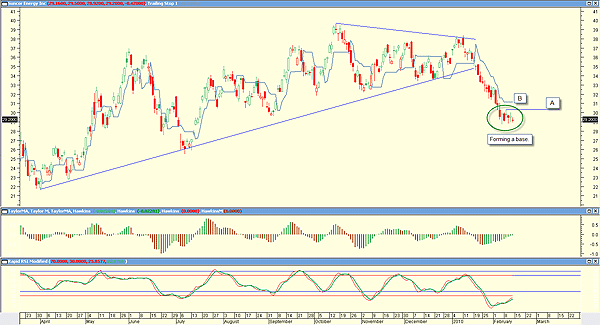
| Figure 2, a daily chart, shows that a solid base is forming, suggesting a buy signal if any one of the following happens: a. The price rises above the pivot point A' b. The price breaks above the trailing stop at B' c. The rapid RSI has given a buy signal by breaking above the moving average (green), but we can wait for the indicator to break above the 30 horizontal line and confirm the buy. d. The Hawkins MACD turned green and gave an early warning buy signal. We can also wait for a movement above zero as confirmation. Suncor Energy is a stock that moves with the oil price and can be bought when the oil price starts rising. The stock price is in oversold territory, suggesting a buy signal is in the offing. |
Has been a technical analyst since 1969, and has worked as a futures and options trader with First Financial Futures in Johannesburg, South Africa.
| Address: | 3256 West 24th Ave |
| Vancouver, BC | |
| Phone # for sales: | 6042634214 |
| E-mail address: | petroosp@gmail.com |
Click here for more information about our publications!
Comments
Date: 02/19/10Rank: 3Comment:

Request Information From Our Sponsors
- StockCharts.com, Inc.
- Candle Patterns
- Candlestick Charting Explained
- Intermarket Technical Analysis
- John Murphy on Chart Analysis
- John Murphy's Chart Pattern Recognition
- John Murphy's Market Message
- MurphyExplainsMarketAnalysis-Intermarket Analysis
- MurphyExplainsMarketAnalysis-Visual Analysis
- StockCharts.com
- Technical Analysis of the Financial Markets
- The Visual Investor
- VectorVest, Inc.
- Executive Premier Workshop
- One-Day Options Course
- OptionsPro
- Retirement Income Workshop
- Sure-Fire Trading Systems (VectorVest, Inc.)
- Trading as a Business Workshop
- VectorVest 7 EOD
- VectorVest 7 RealTime/IntraDay
- VectorVest AutoTester
- VectorVest Educational Services
- VectorVest OnLine
- VectorVest Options Analyzer
- VectorVest ProGraphics v6.0
- VectorVest ProTrader 7
- VectorVest RealTime Derby Tool
- VectorVest Simulator
- VectorVest Variator
- VectorVest Watchdog
