HOT TOPICS LIST
- MACD
- Fibonacci
- RSI
- Gann
- ADXR
- Stochastics
- Volume
- Triangles
- Futures
- Cycles
- Volatility
- ZIGZAG
- MESA
- Retracement
- Aroon
INDICATORS LIST
LIST OF TOPICS
PRINT THIS ARTICLE
by Donald W. Pendergast, Jr.
Even a garden-variety trading system can outperform, if you know how or when to deploy it in a strongly trending market. Here are a few ideas that might help improve the performance of the trading systems you use.
Position: N/A
Donald W. Pendergast, Jr.
Donald W. Pendergast is a financial markets consultant who offers specialized services to stock brokers and high net worth individuals who seek a better bottom line for their portfolios.
PRINT THIS ARTICLE
TRADING SYSTEMS
Trading System Logic: Considering The Power Of A Long-Term Trend
02/17/10 12:43:38 PMby Donald W. Pendergast, Jr.
Even a garden-variety trading system can outperform, if you know how or when to deploy it in a strongly trending market. Here are a few ideas that might help improve the performance of the trading systems you use.
Position: N/A
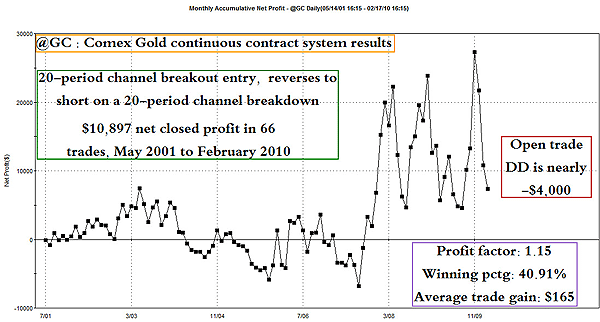
| Simple channel breakout systems can and do return profitable results overall, but if you learn how to filter out trade entries that are contrary to the obvious long-term (technical and fundamental) trend, the results will usually improve to a noticeable degree. Let's look first at a channel breakout system that enters long on a break above the highest high of the last 20 trading days and that goes short (reversing direction) on a break below the lowest low of the last 20 trading sessions. Here are some of the key statistics and parameters for such a system that trades the full-sized COMEX gold contract: Test period: May 21, 2001, to February 16, 2010 Account size: $30,000 Commission: $2.75 per side Slippage: $10 per trade Contracts: 1 Long and short combined results: Profit factor: 1.15 Net profit: $10,897 Trades: 66 Winners: 27 Losers: 39 Win ratio: 40.19% Average trade: $165.11 Max open trade drawdown: ($25, 267) Max closed trade drawdown: ($12,524) Consecutive winners: 3 Consecutive losers: 8 Yes, the basic system is profitable, but it's just not practical for modestly capitalized traders to implement; look at the maximum open trade drawdown figure -- it's more than -$25,000, or nearly 2-1/2 times as much as the final net profit of this system! The equity curve is shown in Figure 1. |

|
| FIGURE 1: COMEX GOLD. Yes, this system makes money, but the equity curve suggests that it just isn't an attractive way to deploy your futures trading account margin. |
| Graphic provided by: TradeStation. |
| Graphic provided by: TradeStation Strategy tester equity curve. |
| |
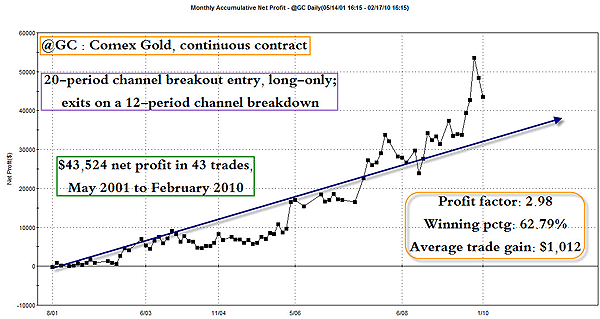
| Yes, it's a real meat-grinder of a system, one that should not be traded according to the system settings specified. But wait, does this mean that channel breakout systems are useless? By no means. In fact, if we modify the original parameters to only take long trades (long on a 20-day channel break to the upside and flat on a 12-day channel break to the downside), due to the long-term secular uptrend in the gold market, look at how much better the results are: Test period: May 21, 2001, to February 16, 2010 Account size: $30,000 Commission: $2.75 per side Slippage: $10 per trade Contracts: 1 Long trade only results: Profit factor: 2.98 Net profit: $43,524 Trades: 43 Winners: 27 Losers: 16 Win ratio: 62.17% Average trade: $1,012.44 Max open trade Drawdown: ($19,772) Max closed trade drawdown: ($8,237) Consecutive winners: 5 Consecutive losers: 3 While this long-only version of the system still has a noticeably high maximum intratrade drawdown (but still better than the original system), take a look at the win/loss ratio, profit factor, average trade profit, and all of the other stats -- clearly, trading gold from the long side for most of the past nine years was a winning strategy for long-term trend-followers. Figure 2 shows the equity curve for the long-only system. |

|
| FIGURE 2: COMEX GOLD. Taking only long trade entries during strongly trending periods in the gold futures market substantially boosts profits and minimizes drawdown; this backtested equity curve covers nearly nine years of trading activity. |
| Graphic provided by: TradeStation. |
| Graphic provided by: TradeStation Strategy tester equity curve. |
| |
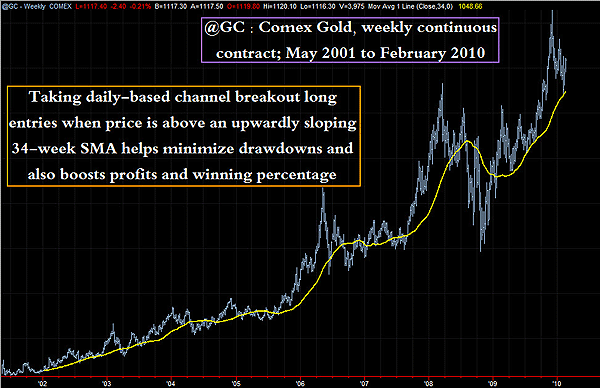
| Finally, here's a weekly chart (shown in Figure 3) of the continuous COMEX gold contract since May 2001. I've overlaid it with a 34-week simple moving average in an attempt to ascertain the trend for this market. According to market technician/author/trader Jim Berg (see his February 2005 article in STOCKS & COMMODITIES for more information), any market that is trading above its upward sloping 34-week SMA and is also making a series of higher swing highs and higher swing lows is in an uptrend. You'll miss a few good trades along the way, but the number of losing trades you'll likely avoid will more than offset the missed trades. Another excellent trend-delineating moving average is the 50-period exponential moving average (50-period EMA), and truly long-term traders might also consider applying an 89-period SMA to a daily chart or a 12-period SMA to a monthly chart to help determine the dominant trend in any given time frame. |

|
| FIGURE 3: COMEX GOLD. Applying a 34-week SMA as a simple trend filter may help in identifying periods of bullish and bearish price action in any given market. Note how the slope of the moving average can help confirm exceptionally strong trending periods. |
| Graphic provided by: TradeStation. |
| |
| The bottom line here is this: When your favorite market is in a strong long-term uptrend or downtrend, consider only entering the market in the same direction as that of the strong trend, ignoring signals that fire in opposition to the trend as was demonstrated in this article. Even a simple system can turn into a major winner when it's properly deployed to take advantage of a strong technical and/or fundamental trend. Take some time and work with this simple system in your own charting/system development package and see if you can't find numerous ways in which to improve upon it. It could and should be time well spent. |
Donald W. Pendergast is a financial markets consultant who offers specialized services to stock brokers and high net worth individuals who seek a better bottom line for their portfolios.
| Title: | Writer, market consultant |
| Company: | Linear Trading Systems LLC |
| Jacksonville, FL 32217 | |
| Phone # for sales: | 904-239-9564 |
| E-mail address: | lineartradingsys@gmail.com |
Traders' Resource Links | |
| Linear Trading Systems LLC has not added any product or service information to TRADERS' RESOURCE. | |
Click here for more information about our publications!
Comments
Date: 02/18/10Rank: 4Comment:

Request Information From Our Sponsors
- StockCharts.com, Inc.
- Candle Patterns
- Candlestick Charting Explained
- Intermarket Technical Analysis
- John Murphy on Chart Analysis
- John Murphy's Chart Pattern Recognition
- John Murphy's Market Message
- MurphyExplainsMarketAnalysis-Intermarket Analysis
- MurphyExplainsMarketAnalysis-Visual Analysis
- StockCharts.com
- Technical Analysis of the Financial Markets
- The Visual Investor
- VectorVest, Inc.
- Executive Premier Workshop
- One-Day Options Course
- OptionsPro
- Retirement Income Workshop
- Sure-Fire Trading Systems (VectorVest, Inc.)
- Trading as a Business Workshop
- VectorVest 7 EOD
- VectorVest 7 RealTime/IntraDay
- VectorVest AutoTester
- VectorVest Educational Services
- VectorVest OnLine
- VectorVest Options Analyzer
- VectorVest ProGraphics v6.0
- VectorVest ProTrader 7
- VectorVest RealTime Derby Tool
- VectorVest Simulator
- VectorVest Variator
- VectorVest Watchdog
