HOT TOPICS LIST
- MACD
- Fibonacci
- RSI
- Gann
- ADXR
- Stochastics
- Volume
- Triangles
- Futures
- Cycles
- Volatility
- ZIGZAG
- MESA
- Retracement
- Aroon
INDICATORS LIST
LIST OF TOPICS
PRINT THIS ARTICLE
by Chaitali Mohile
After undergoing a bullish breakout, the iShares Silver Trust formed an intermediate top.
Position: Sell
Chaitali Mohile
Active trader in the Indian stock markets since 2003 and a full-time writer. Trading is largely based upon technical analysis.
PRINT THIS ARTICLE
HEAD & SHOULDERS
SLV Breaches Important Support Line
02/12/10 07:35:29 AMby Chaitali Mohile
After undergoing a bullish breakout, the iShares Silver Trust formed an intermediate top.
Position: Sell
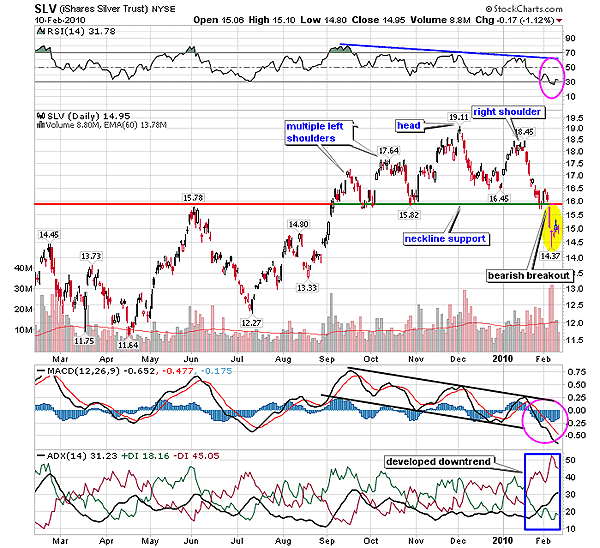
| In Figure 1, the iShares Silver Trust (SLV) converted the $15.78 resistance to support in September 2009. SLV retraced to challenge the freshly formed support from the new highs of the rally. Retesting the new support after the breakout is a common technical behavior of stocks and indexes. But hitting the same support frequently indicates a weakness in the rally. The relative strength index (RSI) (14) formed a double top during the resistance breakout at 15.78 levels. Later, the oscillator developed lower highs, suggesting failure in building up the bullish strength. The daily time frame shows one-year data in Figure 1. The average directional movement index (ADX) (14) was unable to surge above the 20 levels, so the trend development has been a point of concern for SLV. The ADX (14) in Figure 1 shows huge selling and buying pressure. In addition, the lower highs and lower bottoms of the moving average convergence/divergence (MACD) (12,26,9) formed a descending channel. |

|
| FIGURE 1: SLV, DAILY. The bearish indicator would help SLV hit its breakout target of $12.53. |
| Graphic provided by: StockCharts.com. |
| |
| These bearish scenarios restricted the breakout journey. As a result, SLV formed a head & shoulders top pattern with a neckline support at 16 levels. The support-resistance tool line is used to highlight the neckline as well as the support-resistance level that was challenged frequently. Because the bullish rally had just begun, the volume during the multiple left shoulder formation was high. The descending rally from $19 formed the head, signaling the possibility of the bearish reversal formation. Thereafter, volume turned volatile. The three indicators continued their journey in the bearish region. The neckline support was breached, encouraging the bearish hold on SLV. The breakout dragged the ADX (14) down to the 20 level, developing a downtrend. Later, as the stock plunged to $14.50, the downtrend developed and the MACD (12,26,9) slipped into negative territory. |
| Thus, SLV is likely to hit the target of the head & shoulders bearish breakout. The potential target is calculated by measuring the distance between the neckline and the highest peak (head). Therefore, subtracting the distance measured from the breakout level (neckline), we got the minimum estimated level; 19.11 - 15.82 = 3.29. Subtracting 3.29 from 15.82 gives you 12.53, which is the downside target. Traders may strike a sell setup at the current levels with the target of 12.53. The RSI (14) seems reluctant to surge from an oversold area below 30 levels, showing a robust bearish strength; the downtrend has developed and the MACD (12,26,9) is negative. Hence, SLV is likely to hit the downside target of $12.53. |
Active trader in the Indian stock markets since 2003 and a full-time writer. Trading is largely based upon technical analysis.
| Company: | Independent |
| Address: | C1/3 Parth Indraprasth Towers. Vastrapur |
| Ahmedabad, Guj 380015 | |
| E-mail address: | chaitalimohile@yahoo.co.in |
Traders' Resource Links | |
| Independent has not added any product or service information to TRADERS' RESOURCE. | |
Click here for more information about our publications!
PRINT THIS ARTICLE

Request Information From Our Sponsors
- StockCharts.com, Inc.
- Candle Patterns
- Candlestick Charting Explained
- Intermarket Technical Analysis
- John Murphy on Chart Analysis
- John Murphy's Chart Pattern Recognition
- John Murphy's Market Message
- MurphyExplainsMarketAnalysis-Intermarket Analysis
- MurphyExplainsMarketAnalysis-Visual Analysis
- StockCharts.com
- Technical Analysis of the Financial Markets
- The Visual Investor
- VectorVest, Inc.
- Executive Premier Workshop
- One-Day Options Course
- OptionsPro
- Retirement Income Workshop
- Sure-Fire Trading Systems (VectorVest, Inc.)
- Trading as a Business Workshop
- VectorVest 7 EOD
- VectorVest 7 RealTime/IntraDay
- VectorVest AutoTester
- VectorVest Educational Services
- VectorVest OnLine
- VectorVest Options Analyzer
- VectorVest ProGraphics v6.0
- VectorVest ProTrader 7
- VectorVest RealTime Derby Tool
- VectorVest Simulator
- VectorVest Variator
- VectorVest Watchdog
