HOT TOPICS LIST
- MACD
- Fibonacci
- RSI
- Gann
- ADXR
- Stochastics
- Volume
- Triangles
- Futures
- Cycles
- Volatility
- ZIGZAG
- MESA
- Retracement
- Aroon
INDICATORS LIST
LIST OF TOPICS
PRINT THIS ARTICLE
by Chaitali Mohile
In the current turbulent global financial markets, traders may find attractive selling opportunities. Here is one stock that could be a good guideline.
Position: Sell
Chaitali Mohile
Active trader in the Indian stock markets since 2003 and a full-time writer. Trading is largely based upon technical analysis.
PRINT THIS ARTICLE
BREAKOUTS
Short Selling JKHY
02/10/10 02:18:19 PMby Chaitali Mohile
In the current turbulent global financial markets, traders may find attractive selling opportunities. Here is one stock that could be a good guideline.
Position: Sell
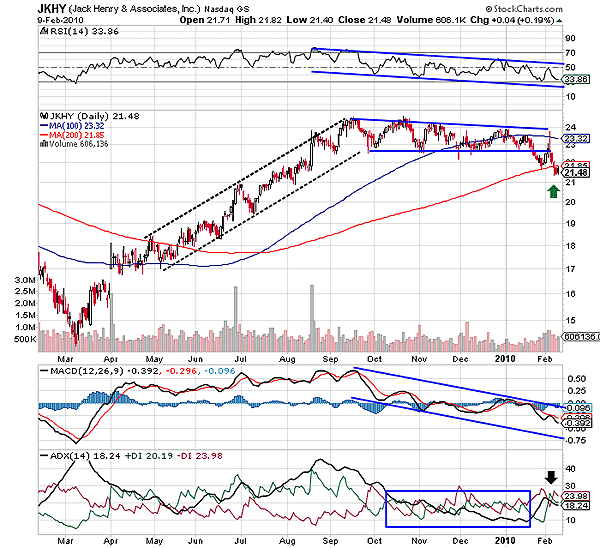
| Jack Henry & Associates (JKHY) has been consolidating the past five months. The consolidation after an advanced rally formed a bullish flag & pennant continuation pattern. During the sideways consolidation in Figure 1, the stock formed the lower peaks and a stable bottom. Although a descending triangle is visible on the daily time frame, the pattern is considered to be a bullish flag & pennant. The declining upper range signifies the weakness in the rally. The relative strength index (RSI) (14) also descended, forming the series of lower highs and lower bottoms, and the moving average convergence/divergence (MACD) (12,26,9) performed in a similar manner. In fact, the momentum indicator has plunged in negative territory and the zigzag movement shows high volatility in price action. After drifting from overheated uptrend levels, the average directional movement index (ADX) (14) moved in a weak region below 15 levels. Therefore, the lack of bullish strength resulted in the descending flag formation. |

|
| FIGURE 1: JKHY, DAILY. The stock has breached the 200-day MA support. |
| Graphic provided by: StockCharts.com. |
| |
| In the current turmoil, stocks like JKHY could offer trading opportunities. The lower highs during consolidation are themselves a short-term bearish indication. Although the descending flag formation after an advance rally is a bullish continuation pattern, the high volatility would harm the formation. Such unanticipated breakdowns would open fresh short positions. Breaching the lower range of the bullish consolidation is an intraday bearish breakdown. In such conditions, traders should be more careful while triggering the short positions, as the prices are likely to bounce back to retest the upper-range resistance, whipsawing the hasty short trades. In Figure 1, before the real breakdown occurred, JKHY surged with the support of the 200-day moving average (MA) and reached the upper-range resistance in one single session. An opening below the lower trendline reconfirmed a breakdown in Figure 1. |
| JKHY has violated an immediate support of the 200-day MA and is ready to plunge further. But are the indicators highlighting the downside move? According to the intraday chart, that is Figure 1, the ADX (14) is below 20 with equal buying and selling pressure, suggesting the possibility of the consolidation below the new 200-day MA resistance. The RSI (14) is currently in no-man's land (the range between 50 and 30), and the MACD (12,26,9) remains negative. Due to these mixed indications, JKHY would not plunge very hard. |

|
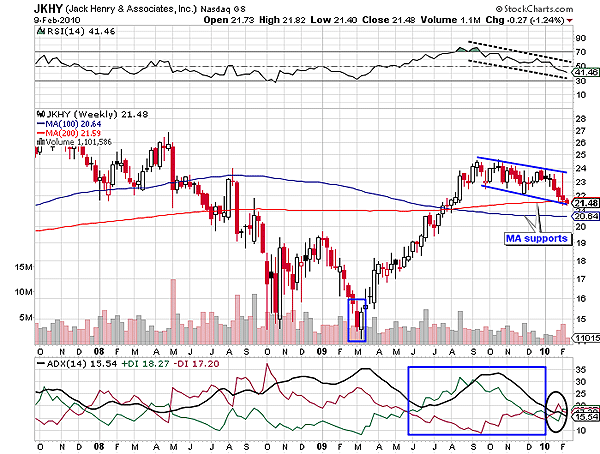
| FIGURE 2: JKHY, WEEKLY. The 100- and 200-day MAs are the two major supports for the declining rally. |
| Graphic provided by: StockCharts.com. |
| |
| On the weekly time frame in Figure 2, the advance rally of $10 (24-14) turned horizontal near $24, forming the bullish flag & pennant pattern. Since the same pattern has appeared on both time frames of JKHY, it is considered to be the most reliable formation. But the descending uptrend reflected by the ADX (14) in Figure 2 resulted in a descending flag formation. The decreasing bullish strength was another reason for the lower highs and lowers lows. The 100- and 200-day MAs are the immediate supports for the possible breakdown. These supports are likely to prevent the corrective rally in the future. Those already short can carry their positions with the target of 100-day MA support. The ADX (14) at 15 levels is reflecting a weak trend. However, the current volatility in the financial market might drag the indicators in the bearish areas and simultaneously pull down the price, violating all the aforementioned supports in Figure 2. |
| The whole scenario has not turned bearish enough to pull down JKHY sharply. But if trades come across similar stock types with indicators ready to turn healthily bearish, they can strike a fresh short trade. The stock would drop faster if all the supports are already violated. The next lower support would act as a target for the declining rally. |
Active trader in the Indian stock markets since 2003 and a full-time writer. Trading is largely based upon technical analysis.
| Company: | Independent |
| Address: | C1/3 Parth Indraprasth Towers. Vastrapur |
| Ahmedabad, Guj 380015 | |
| E-mail address: | chaitalimohile@yahoo.co.in |
Traders' Resource Links | |
| Independent has not added any product or service information to TRADERS' RESOURCE. | |
Click here for more information about our publications!
Comments
Date: 02/15/10Rank: 2Comment:

Request Information From Our Sponsors
- StockCharts.com, Inc.
- Candle Patterns
- Candlestick Charting Explained
- Intermarket Technical Analysis
- John Murphy on Chart Analysis
- John Murphy's Chart Pattern Recognition
- John Murphy's Market Message
- MurphyExplainsMarketAnalysis-Intermarket Analysis
- MurphyExplainsMarketAnalysis-Visual Analysis
- StockCharts.com
- Technical Analysis of the Financial Markets
- The Visual Investor
- VectorVest, Inc.
- Executive Premier Workshop
- One-Day Options Course
- OptionsPro
- Retirement Income Workshop
- Sure-Fire Trading Systems (VectorVest, Inc.)
- Trading as a Business Workshop
- VectorVest 7 EOD
- VectorVest 7 RealTime/IntraDay
- VectorVest AutoTester
- VectorVest Educational Services
- VectorVest OnLine
- VectorVest Options Analyzer
- VectorVest ProGraphics v6.0
- VectorVest ProTrader 7
- VectorVest RealTime Derby Tool
- VectorVest Simulator
- VectorVest Variator
- VectorVest Watchdog
