HOT TOPICS LIST
- MACD
- Fibonacci
- RSI
- Gann
- ADXR
- Stochastics
- Volume
- Triangles
- Futures
- Cycles
- Volatility
- ZIGZAG
- MESA
- Retracement
- Aroon
INDICATORS LIST
LIST OF TOPICS
PRINT THIS ARTICLE
by Alan R. Northam
By using two different methods of technical analysis, it is possible to arrive at a confluence of price and time that defines not only a price target but a date at which the price target is expected to be reached.
Position: N/A
Alan R. Northam
Alan Northam lives in the Dallas, Texas area and as an electronic engineer gave him an analytical mind from which he has developed a thorough knowledge of stock market technical analysis. His abilities to analyze the future direction of the stock market has allowed him to successfully trade of his own portfolio over the last 30 years. Mr. Northam is now retired and trading the stock market full time. You can reach him at inquiry@tradersclassroom.com or by visiting his website at http://www.tradersclassroom.com. You can also follow him on Twitter @TradersClassrm.
PRINT THIS ARTICLE
TECHNICAL ANALYSIS
A Confluence Of Price And Time
02/09/10 09:03:18 AMby Alan R. Northam
By using two different methods of technical analysis, it is possible to arrive at a confluence of price and time that defines not only a price target but a date at which the price target is expected to be reached.
Position: N/A
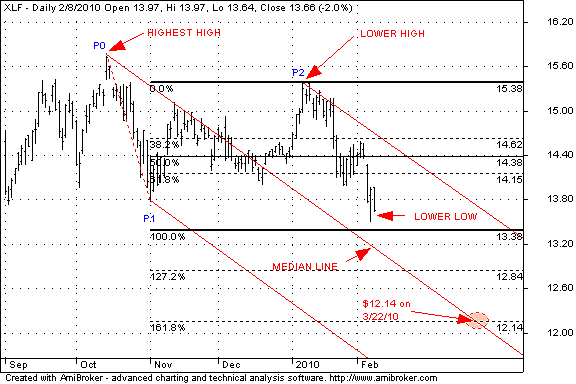
| The financial market sector SPDR exchange traded fund (XLF) rallied off the March 2009 low and made its highest high price in October 2009 (see Figure 1). Since then, the financial market sector has made a new intermediate-term lower high in early 2010 and a lower low in February 2010, signaling that the intermediate-term trend has now reversed from up to down. Intermediate-term trends normally last for several months. |

|
| FIGURE 1: XLF, DAILY. Andrews pitchfork and Fibonacci extensions point to the confluence of price and time. |
| Graphic provided by: AmiBroker.com. |
| |
| With the intermediate-term trend now having turned down, three significant pivot points have been formed and labeled P0, P1 and P2 on the chart. These three significant pivot points allow for the drawing of the Andrews pitchfork. The center line of the pitchfork is known as the median line. The pitchfork's creator, Alan Hall Andrews, recognized that 80% of the time price would be drawn to this line before reversing back upward. Andrews also recognized that the median line represented an area where price was most likely to reverse. By this he meant that once price reached the median line, it did not necessarily mean that price would immediately reverse back up but that price often traveled along the median line for some time before a price reversal would actually occur. Therefore, expect price to move down to the median line and then start to follow it until the time has come for price to reverse back up. This leaves us with the question as to when to expect price to reverse back upward. There are many ways to make this forecast, but I have chosen to use a common Elliott wave relationship to determine when price should be ready to reverse back upward. |
| According to the Elliott wave theory, wave 3 is normally 1.618 times the length of wave 1. Therefore, if we take the length of the wave represented by the distance between significant pivot point P0 and P1, multiply this by 1.618 and then subtract this product from P2, we arrive at a price of $12.14. To illustrate this on the chart, I have used the Fibonacci extension tool. |
| By combining the pitchfork analysis and the Elliott wave theory, we have arrived at a price and time target. Price should now move down to the median line of the pitchfork and travel along it until it reaches $12.14. This should occur on or around March 22, 2010, where the median line of the pitchfork intersects with $12.14 where price and time come together. |
| In conclusion, by using two different methods of technical analysis, it is possible to define a point at which price and time come together to provide not only a price target but a date at which price is expected to hit its target price. This is called a confluence of price and time. |
Alan Northam lives in the Dallas, Texas area and as an electronic engineer gave him an analytical mind from which he has developed a thorough knowledge of stock market technical analysis. His abilities to analyze the future direction of the stock market has allowed him to successfully trade of his own portfolio over the last 30 years. Mr. Northam is now retired and trading the stock market full time. You can reach him at inquiry@tradersclassroom.com or by visiting his website at http://www.tradersclassroom.com. You can also follow him on Twitter @TradersClassrm.
| Garland, Tx | |
| Website: | www.tradersclassroom.com |
| E-mail address: | inquiry@tradersclassroom.com |
Click here for more information about our publications!
Comments

Request Information From Our Sponsors
- StockCharts.com, Inc.
- Candle Patterns
- Candlestick Charting Explained
- Intermarket Technical Analysis
- John Murphy on Chart Analysis
- John Murphy's Chart Pattern Recognition
- John Murphy's Market Message
- MurphyExplainsMarketAnalysis-Intermarket Analysis
- MurphyExplainsMarketAnalysis-Visual Analysis
- StockCharts.com
- Technical Analysis of the Financial Markets
- The Visual Investor
- VectorVest, Inc.
- Executive Premier Workshop
- One-Day Options Course
- OptionsPro
- Retirement Income Workshop
- Sure-Fire Trading Systems (VectorVest, Inc.)
- Trading as a Business Workshop
- VectorVest 7 EOD
- VectorVest 7 RealTime/IntraDay
- VectorVest AutoTester
- VectorVest Educational Services
- VectorVest OnLine
- VectorVest Options Analyzer
- VectorVest ProGraphics v6.0
- VectorVest ProTrader 7
- VectorVest RealTime Derby Tool
- VectorVest Simulator
- VectorVest Variator
- VectorVest Watchdog
