

HOT TOPICS LIST
- MACD
- Fibonacci
- RSI
- Gann
- ADXR
- Stochastics
- Volume
- Triangles
- Futures
- Cycles
- Volatility
- ZIGZAG
- MESA
- Retracement
- Aroon
INDICATORS LIST
LIST OF TOPICS
PRINT THIS ARTICLE
by Chaitali Mohile
Many indexes, sectors, and stocks may be facing tough trading sessions and huge volatility. XLB has the same challenge.
Position: Sell
Chaitali Mohile
Active trader in the Indian stock markets since 2003 and a full-time writer. Trading is largely based upon technical analysis.
PRINT THIS ARTICLE
REVERSAL
Two Bearish Reversals Of XLB
02/08/10 02:10:52 PMby Chaitali Mohile
Many indexes, sectors, and stocks may be facing tough trading sessions and huge volatility. XLB has the same challenge.
Position: Sell
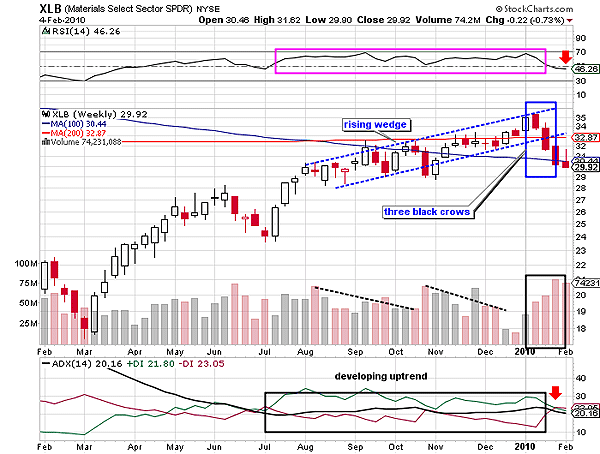
| The August 2009 rally of the Material Select Sector SPDR (XLB) offered healthy gains to traders. The sector moved with a steady speed and eventually violated the moving average (MA) resistance that is 100- and 200-day MA. By the time both resistances were converted to support, the picture on the weekly time frame in Figure 1 was clear. The upward movement of XLB formed a rising wedge formation, which discouraged position traders. The rising wedge formation was both shocking and heartbreaking for them. The wedge formation is a bearish reversal that drags prices lower. During the formation volume shrinks, indicating the discomfort among traders. Because of a bearish breakout, traders and investors preferred to stay on the sidelines. |
| In Figure 1, similar conditions appeared, turning the volume volatile. The doji candles with small real bodies show the uncertainty and indecision among traders and investors. The relative strength index (RSI) (14) ranged between 50- and 70-level bullish areas. The average directional movement index (ADX) (14) indicated a developing uptrend throughout XLB's bullish rally. These indicators reveal the reason for the rising wedge formation. The range-bound RSI (14) means the bullish force was not strengthening, and the ADX (14) failed to move above 25 levels, although the price surged. Hence, XLB lacked the required bullish strength, resulting in the rising wedge formation. |
|
| FIGURE 1: XLB, WEEKLY. The breakdown of the rising wedge formed the three black crows� candlestick pattern. |
| Graphic provided by: StockCharts.com. |
| |
| Later, the breakdown of the pattern was confirmed as the lower trendline was breached and the seller's volume increased (see the black rectangle). While breaking down, the second bearish candle (red) in Figure 1 opened near the previous close, creating the possibility of another robust bearish reversal formation, but this time a candlestick pattern. The second candle closed below the 200-day MA, highlighting the possibility of a major breakdown. Violating the 200-day MA support is considered to be a robust trend reversal signal. The RSI (14) slipped below 50 and selling pressure increased. The third candle opened marginally above the previous close (closing level of second candle), and thus, the three black crows candlestick pattern appeared on Figure 1. |
| The three black crows is a bearish reversal candlestick pattern. The group of three consecutive big bearish candles makes the formation one of the strongest candlestick patterns. The uptrend is about to be reversed; the selling pressure (red line) in Figure 1 has surged above the buying pressure (green line) in the ADX (14). This reflects that the downtrend for XLB is developing. The fourth bearish candle has reconfirmed the bearish breakout by opening below the previous close. The breakout would bring fresh selling pressure in the sector index and drag down the price levels. However, for the new short positions, traders should wait till the indicator turns healthily bearish, or look for the opening below or near the low of the current candle (fourth candle). |
| The two bearish reversal formations have weakened XLB. The big picture suggests the fresh bearish journey of the sector index. |
Active trader in the Indian stock markets since 2003 and a full-time writer. Trading is largely based upon technical analysis.
| Company: | Independent |
| Address: | C1/3 Parth Indraprasth Towers. Vastrapur |
| Ahmedabad, Guj 380015 | |
| E-mail address: | chaitalimohile@yahoo.co.in |
Traders' Resource Links | |
| Independent has not added any product or service information to TRADERS' RESOURCE. | |
Click here for more information about our publications!
PRINT THIS ARTICLE

Request Information From Our Sponsors
- StockCharts.com, Inc.
- Candle Patterns
- Candlestick Charting Explained
- Intermarket Technical Analysis
- John Murphy on Chart Analysis
- John Murphy's Chart Pattern Recognition
- John Murphy's Market Message
- MurphyExplainsMarketAnalysis-Intermarket Analysis
- MurphyExplainsMarketAnalysis-Visual Analysis
- StockCharts.com
- Technical Analysis of the Financial Markets
- The Visual Investor
- VectorVest, Inc.
- Executive Premier Workshop
- One-Day Options Course
- OptionsPro
- Retirement Income Workshop
- Sure-Fire Trading Systems (VectorVest, Inc.)
- Trading as a Business Workshop
- VectorVest 7 EOD
- VectorVest 7 RealTime/IntraDay
- VectorVest AutoTester
- VectorVest Educational Services
- VectorVest OnLine
- VectorVest Options Analyzer
- VectorVest ProGraphics v6.0
- VectorVest ProTrader 7
- VectorVest RealTime Derby Tool
- VectorVest Simulator
- VectorVest Variator
- VectorVest Watchdog