HOT TOPICS LIST
- MACD
- Fibonacci
- RSI
- Gann
- ADXR
- Stochastics
- Volume
- Triangles
- Futures
- Cycles
- Volatility
- ZIGZAG
- MESA
- Retracement
- Aroon
INDICATORS LIST
LIST OF TOPICS
PRINT THIS ARTICLE
by Koos van der Merwe
Recently, I wrote an article based on the S&P 100 about why I am not a bear. Here is a varying view on that Elliott wave count and market forecast.
Position: Accumulate
Koos van der Merwe
Has been a technical analyst since 1969, and has worked as a futures and options trader with First Financial Futures in Johannesburg, South Africa.
PRINT THIS ARTICLE
ELLIOTT WAVE
Could The Wave Count Already Be Completed?
02/05/10 02:33:03 PMby Koos van der Merwe
Recently, I wrote an article based on the S&P 100 about why I am not a bear. Here is a varying view on that Elliott wave count and market forecast.
Position: Accumulate
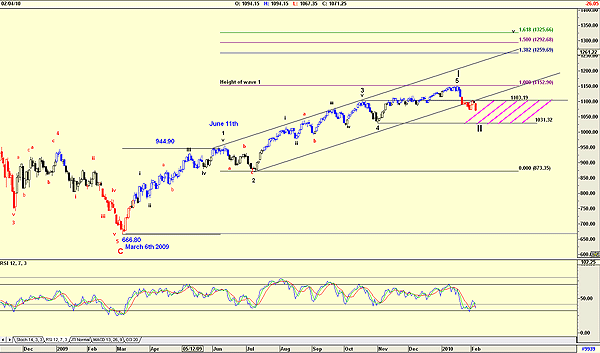
| In the chart of the Standard & Poor's 100, I showed an Elliott wave count suggesting that a wave 5 top had yet to come. The daily chart of the S&P 500 suggests that the wave count could already be completed if not close to completion. |

|
| FIGURE 1: S&P 500, DAILY |
| Graphic provided by: AdvancedGET. |
| |
| Figure 1 suggests that wave I is complete and that the index is in the process of completing wave II. I write "completing," because the wave II could end anywhere in the fourth wave of lesser degree, the highlighted area, which means that it could fall as low as 1031.32. The relative strength index (RSI ), however, suggests that the bottom of wave II is close at hand as it is oversold, but with all the bad news about unemployment not easing in the United States, and the smaller countries in Europe like Greece, Portugal, and Lithuania only now facing financial difficulties, the last cockroach coming out of the woodwork, so to speak, the wave II bottom may be a complicated one and take many weeks to bottom, if not months. |

|
| FIGURE 2: DJIA, DAILY |
| Graphic provided by: AdvancedGET. |
| |
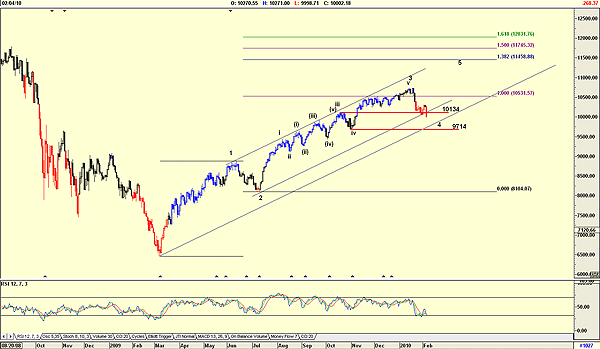
| Figure 2, a chart of the Dow Jones Industrial Average (DJIA), although the chart looks similar to the S&P 500 is currently suggesting that wave I is not complete and that the chart is currently tracing wave 4 of wave I with a target of anywhere between 10134 and 9714. Once again, the RSI is oversold. |

|
| FIGURE 3: DJIA, MONTHLY |
| Graphic provided by: AdvancedGET. |
| |
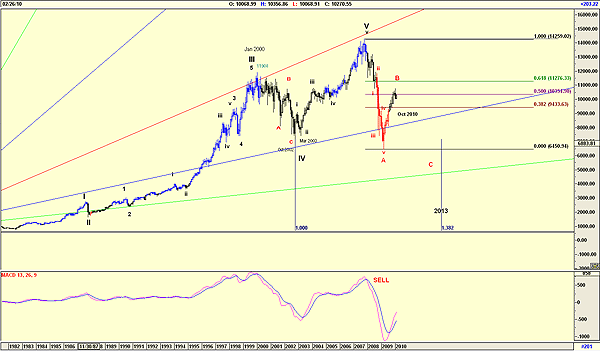
| Many analysts, however, believe that the wave shown in the monthly chart of the DJIA (Figure 3) is a B-wave in the major ABC correction of the DJIA and are therefore calling for a major collapse starting now. The chart shows their wave count with a projected C-bottom sometime in 2013 at the Gann 1 x 4 line of less than 5000. The chart looks acceptable, and possible, and could indeed occur. |

|
| FIGURE 4: S&P 500, MONTHLY |
| Graphic provided by: AdvancedGET. |
| |
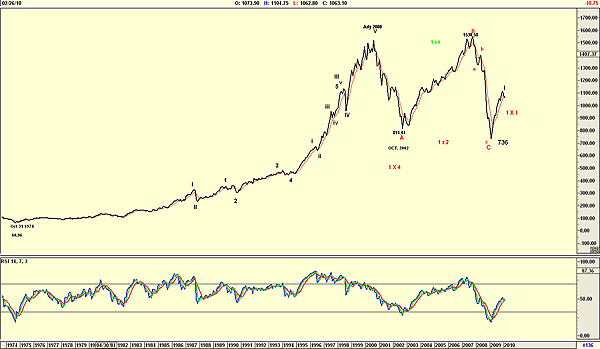
| Being an optimist, however, and finding that the last of the cockroaches are starting to appear, I prefer to believe in the monthly chart of the S&P 500 (Figure 4). What also talks to me in this chart is the RSI, which is in buy mode. Time will tell who is correct. |
Has been a technical analyst since 1969, and has worked as a futures and options trader with First Financial Futures in Johannesburg, South Africa.
| Address: | 3256 West 24th Ave |
| Vancouver, BC | |
| Phone # for sales: | 6042634214 |
| E-mail address: | petroosp@gmail.com |
Click here for more information about our publications!
Comments
Date: 02/08/10Rank: Comment: Hi Are you offering your regular subcription as i would like to subcribe please advice
rajsun@mtnl.net.in

Request Information From Our Sponsors
- StockCharts.com, Inc.
- Candle Patterns
- Candlestick Charting Explained
- Intermarket Technical Analysis
- John Murphy on Chart Analysis
- John Murphy's Chart Pattern Recognition
- John Murphy's Market Message
- MurphyExplainsMarketAnalysis-Intermarket Analysis
- MurphyExplainsMarketAnalysis-Visual Analysis
- StockCharts.com
- Technical Analysis of the Financial Markets
- The Visual Investor
- VectorVest, Inc.
- Executive Premier Workshop
- One-Day Options Course
- OptionsPro
- Retirement Income Workshop
- Sure-Fire Trading Systems (VectorVest, Inc.)
- Trading as a Business Workshop
- VectorVest 7 EOD
- VectorVest 7 RealTime/IntraDay
- VectorVest AutoTester
- VectorVest Educational Services
- VectorVest OnLine
- VectorVest Options Analyzer
- VectorVest ProGraphics v6.0
- VectorVest ProTrader 7
- VectorVest RealTime Derby Tool
- VectorVest Simulator
- VectorVest Variator
- VectorVest Watchdog
