HOT TOPICS LIST
- MACD
- Fibonacci
- RSI
- Gann
- ADXR
- Stochastics
- Volume
- Triangles
- Futures
- Cycles
- Volatility
- ZIGZAG
- MESA
- Retracement
- Aroon
INDICATORS LIST
LIST OF TOPICS
PRINT THIS ARTICLE
by Chaitali Mohile
After consolidating for about a month and a half, the US Paper Index rallied higher. The index turned downward without hitting the potential target. What's next for the index?
Position: N/A
Chaitali Mohile
Active trader in the Indian stock markets since 2003 and a full-time writer. Trading is largely based upon technical analysis.
PRINT THIS ARTICLE
HEAD & SHOULDERS
The Paper Index Forms Neckline Support
02/04/10 02:39:19 PMby Chaitali Mohile
After consolidating for about a month and a half, the US Paper Index rallied higher. The index turned downward without hitting the potential target. What's next for the index?
Position: N/A
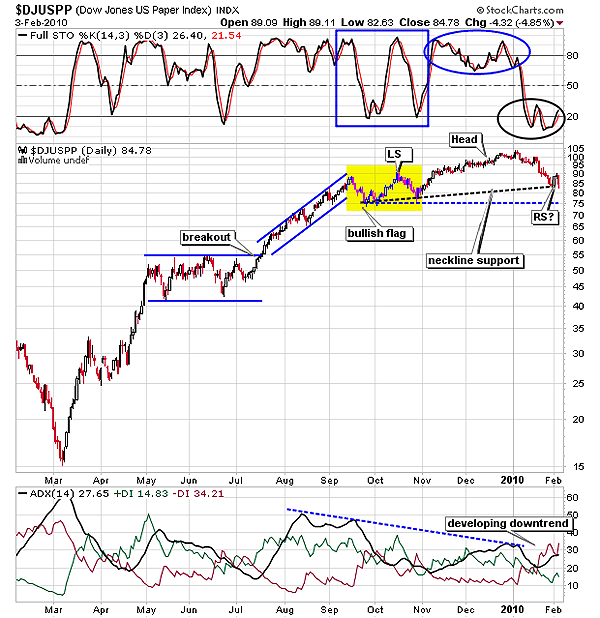
| I mentioned a slowdown in the Dow Jones US Paper Index ($DJUSPP) in my previous article dated September 22, 2009. After an exclusive rally from 55 to 90 levels, $DJUSPP witnessed a volatile consolidation for almost a month and a half. The yellow block in Figure 1 shows the consolidation in a perfect range. You can see that the rally within the range was sharp and formed a bullish flag. The breakout journey from 90 levels surged to reach a target of 90 - 55 = 35 + 90 = 125; however, a declining uptrend unnerved the bullish rally. As a result, $DJUSPP reversed significantly from 105 levels forming a higher low. This formed an ascending neckline support for the left shoulders and the head. |
| The previous peak formed during consolidation is the left shoulder of the head & shoulders top pattern in Figure 1. The sharp vertical movement of the full stochastic (14,3,3) turned shaky, affecting the breakout journey of $DJUSPP. The descending rally formed the head. In addition, the average directional movement index (ADX) (14) drifted from an overheated uptrend region. Further decline in the trend indicator developed a new intermediate downtrend for $DJUSPP. |

|
| FIGURE 1: $DJUSPP, DAILY. The oversold stochastic and the developing downtrend would discourage the bullish strength in the upcoming rally and gradually form the right shoulder. |
| Graphic provided by: StockCharts.com. |
| |
| Back to the price chart, the index is likely to form a right shoulder with the support of an ascending neckline. The volatile stochastic oscillator in an oversold region below the 20 levels, and the developing downtrend in ADX (14) would restrict the upward price action. Hence, the head & shoulders pattern would succeed without any hurdle. But the pattern completion would add the bearish strength, breaking the index downward. The head & shoulders top is a bearish reversal formation, indicating the end of an existing uptrend. The blue dotted line is an immediate support after the breakout. If the right shoulder is formed with this support (blue dotted) in Figure 1, then it could be observed as a neckline as well. |

|
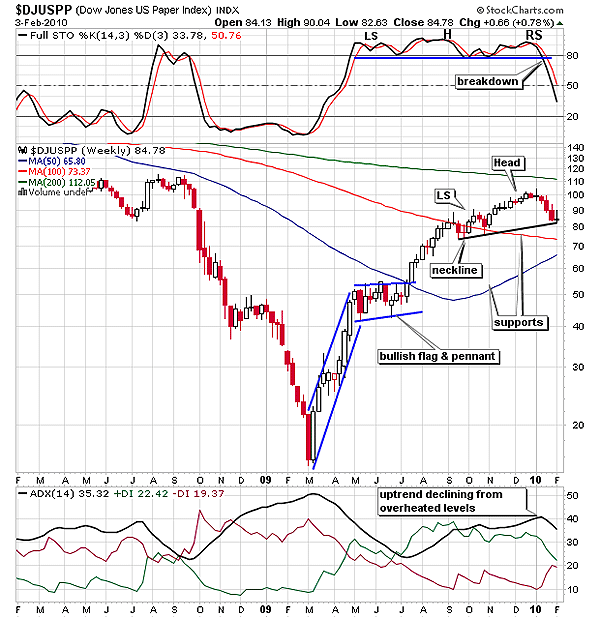
| FIGURE 2: $DJUSPP, WEEKLY. The head & shoulders top formed by the full stochastic (14,3,3) has broken downward. |
| Graphic provided by: StockCharts.com. |
| |
| On the weekly time frame in Figure 2, the bullish flag & pennant formation is clearly visible. After the breakout, $DJUSPP rapidly surged, breaching the 50- and 100-day moving average (MA) resistance. Later, the 200-day MA resistance suppressed the bullish rally, resulting in the bearish move from the higher levels (105). Thus, the head & shoulders top reversal pattern is being constructed. The right shoulder is yet to be formed on the weekly time frame. During the entire price action (starting from the bullish flag & pennant formation till the head & shoulders pattern) the stochastic in Figure 2 was comfortably moving in an overbought zone above 80 levels. Here, the oscillator formed the similar head & shoulders pattern that has already witnessed a bearish breakout. The breakout, therefore, reconfirms the formation on the price chart. The indicator is on the verge of breaching the center line (50 level) support that might weaken the index further. However, to form the right shoulder, the full stochastic has to bounce in the bullish area. Although the uptrend is declining from an overheated region above 40 levels, the ADX (14) is currently indicating the developed uptrend. The green line in the ADX (14) shows that buying pressure is lowering and the selling pressure is picking up (see the red line). |
| Thus, the right shoulder is likely to develop with the support of an ascending neckline and the head & shoulders pattern would be completed. Therefore, the paper industry is likely to enter the short-term downtrend. The index is likely to plunge to (100 - 80 = 20 - 80 = 60) at 60. There are two moving average supports. One is the 100-day MA at 73 and the second is the 50-day MA at 65 for $DJUSPP before hitting the target. Hence, $DJUSPP would undergo a steady bearish rally and not a steep vertical decline. |
Active trader in the Indian stock markets since 2003 and a full-time writer. Trading is largely based upon technical analysis.
| Company: | Independent |
| Address: | C1/3 Parth Indraprasth Towers. Vastrapur |
| Ahmedabad, Guj 380015 | |
| E-mail address: | chaitalimohile@yahoo.co.in |
Traders' Resource Links | |
| Independent has not added any product or service information to TRADERS' RESOURCE. | |
Click here for more information about our publications!
PRINT THIS ARTICLE

Request Information From Our Sponsors
- VectorVest, Inc.
- Executive Premier Workshop
- One-Day Options Course
- OptionsPro
- Retirement Income Workshop
- Sure-Fire Trading Systems (VectorVest, Inc.)
- Trading as a Business Workshop
- VectorVest 7 EOD
- VectorVest 7 RealTime/IntraDay
- VectorVest AutoTester
- VectorVest Educational Services
- VectorVest OnLine
- VectorVest Options Analyzer
- VectorVest ProGraphics v6.0
- VectorVest ProTrader 7
- VectorVest RealTime Derby Tool
- VectorVest Simulator
- VectorVest Variator
- VectorVest Watchdog
- StockCharts.com, Inc.
- Candle Patterns
- Candlestick Charting Explained
- Intermarket Technical Analysis
- John Murphy on Chart Analysis
- John Murphy's Chart Pattern Recognition
- John Murphy's Market Message
- MurphyExplainsMarketAnalysis-Intermarket Analysis
- MurphyExplainsMarketAnalysis-Visual Analysis
- StockCharts.com
- Technical Analysis of the Financial Markets
- The Visual Investor
