HOT TOPICS LIST
- MACD
- Fibonacci
- RSI
- Gann
- ADXR
- Stochastics
- Volume
- Triangles
- Futures
- Cycles
- Volatility
- ZIGZAG
- MESA
- Retracement
- Aroon
INDICATORS LIST
LIST OF TOPICS
PRINT THIS ARTICLE
by Ron Walker
A fracture of the lower channel line on the daily S&P 500 may be nothing more than an attempt to shake out weak longs -- or does this trend break signal more downside to come?
Position: N/A
Ron Walker
Ron Walker is an active trader and technical analyst. He operates an educational website dedicated to the study of Technical Analysis. The website offers free market analysis with daily video presentations and written commentaries. Ron is a video pioneer, being one of the first to utilize the internet producing Technical Analysis videos. His website is thechartpatterntrader.com
PRINT THIS ARTICLE
REVERSAL
A Shake Or Break For The S&P 500?
02/01/10 01:45:50 PMby Ron Walker
A fracture of the lower channel line on the daily S&P 500 may be nothing more than an attempt to shake out weak longs -- or does this trend break signal more downside to come?
Position: N/A
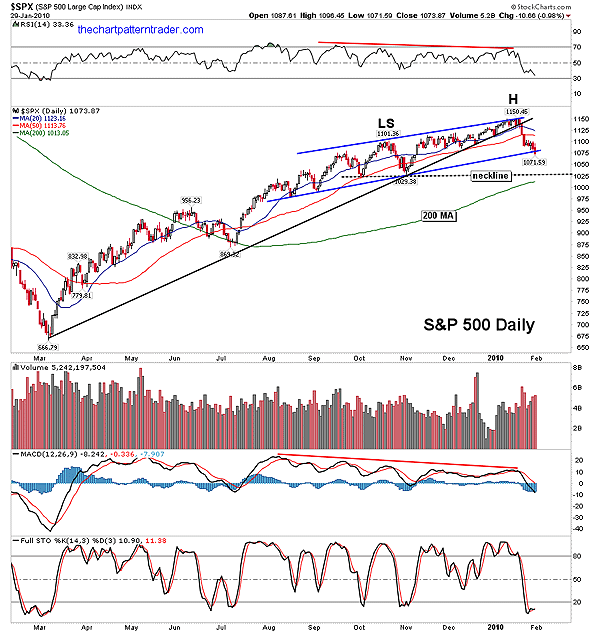
| The Standard & Poor's 500 ($SPX) recently broke its intermediate trendline on the daily time frame (Figure 1), laying the ground work for a possible 1-2-3 trend reversal. This could be the early stages of a major market reversal. The breaking of the trendline is the first phase of three that is required to reverse a trend. The S&P 500 is currently in the stage 1 process of a potential 1-2-3 trend reversal. Stage 1 occurred when prices broke down below the trend intermediate line on January 21 (Figure 1). Once a low is set by the post-trend break, stage 2 will allow prices to rise back up in an attempt to reestablish the uptrend in an effort to test the preceding high made in mid-January. Stage 3 represents the move back down after a failed attempt to exceed the previous high, a move that takes prices beyond the low that was established during the initial breaking of the trendline. |

|
| FIGURE 1: S&P 500, DAILY. After a breakdown of the intermediate trendline, prices fall and collapse below the lower channel line. The 200-day MA is just below the potential neckline of a H&S pattern, offering a springboard in which prices could bounce to form the right shoulder. |
| Graphic provided by: StockCharts.com. |
| |
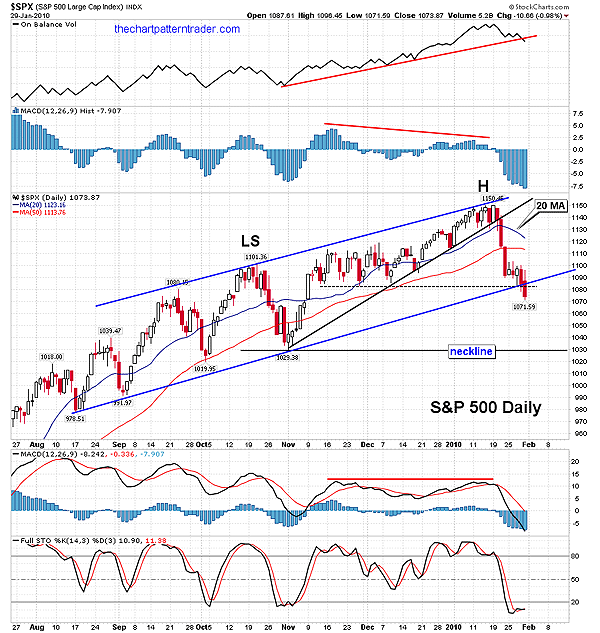
| Figure 2 shows that prices have come to the next important level of support, testing the lower boundary of a multimonth price channel. On January 29, the S&P 500 broke through the point where both horizontal support and the lower channel line intersect. That prices failed to gain traction here may result in prices collapsing back to the 1030 level, which is where the potential neckline comes into play for a speculative head & shoulders (H&S) top. Incidentally, it is also where the 200-day moving average (MA) is hovering. The only way prices could rally back up is if the penetration proves to be a short-term bear trap. |

|
| FIGURE 2: S&P 500, DAILY. A break in the lower channel line may be a shakeout before prices test the 20-day MA. But with a breach in horizontal and rising support, prices could continue to plunge in order to complete the head of a potential head & shoulder top. |
| Graphic provided by: StockCharts.com. |
| |
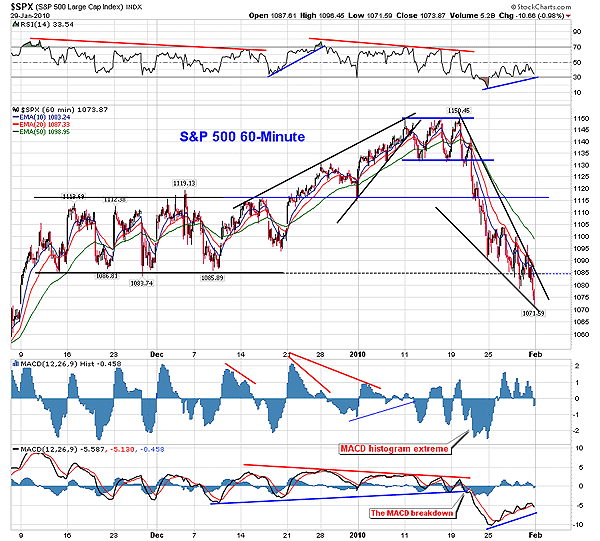
| The hourly chart of the S&P 500 chart in Figure 3 suggests that the breach in the lower channel line could be a short-term bear trap. Note that both the relative strength index (RSI) (14) and the moving average convergence/divergence (MACD) histogram (12, 26, 9) are attempting to chisel out bullish divergences, as prices test the lower boundary of the falling wedge pattern. |

|
| FIGURE 3: S&P 500, HOURLY. A bullish falling wedge appears as bullish divergences forming on the indicators, suggesting that prices could rally for the short term. Note the deep histogram extreme on the histogram. If the histogram completes a higher trough low, the bullish divergence will be complete. |
| Graphic provided by: StockCharts.com. |
| |
| If prices do reverse course and a break to the upside occurs, it may lead an effort to begin stage 2 of the 1-2-3 trend reversal. The S&P 500 could then rally into the 20-day MA and halt at resistance, and then turn and retreat, providing another short opportunity for the bears. If prices are too feeble to rise through the 20-day MA, gravity will drag them back down through the channel line, where a stage follow-through to the downside will complete a 1-2-3 trend reversal. If a rally does occur, a redraw of the lower channel line would be in order. It is uncertain if prices will attempt to complete stage 2 immediately, or if the move will be delayed now that the lower channel line has been broken. This could be a case in which prices refuse to pull back until the next level of support has been tagged. When fear permeates through the market, prices can rapidly decay. And since the rhythm of the channel has already been disrupted with the breaking the lower channel line, we could see some panic selling as prices fall to the potential neckline of the H&S pattern. Once there, prices would likely rise to form a right shoulder, thereby establishing a lower high and complete stage 2. A bounce off the neckline will find resistance at the broken channel line, which could establish a lower peak and the right shoulder by completing phase 2. The broken channel line will act as resistance on any rally (Figure 2). Whether or not prices bounce, getting a short-term pop, or continue to fall to test the neckline at 1030, traders should know that with either scenario, the H&S pattern could be a potential top that could lead to a major correction. The H&S top measures approximately 120 points. Subtracting that from the neckline at 1030 area gives a minimum objective target of 910. |

|
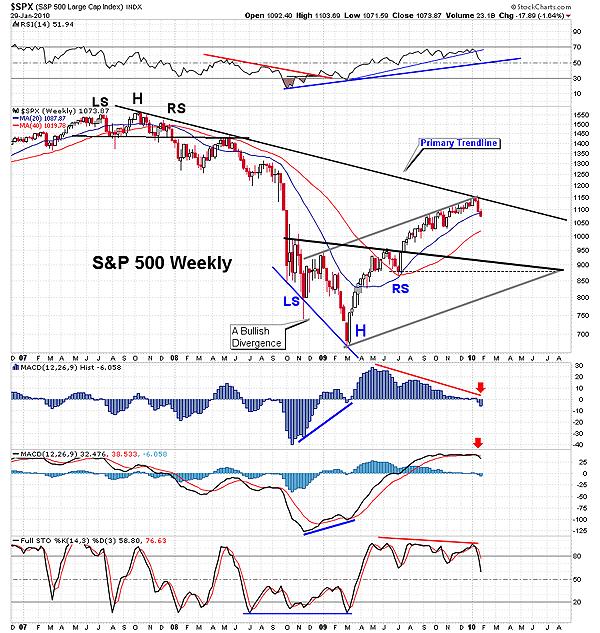
| FIGURE 4: S&P 500, WEEKLY. The reversal off the primary trendline on the S&P 500 weekly chart suggests that prices might backtest the inverse H&S patterns neckline, which intersects with a lower imaginary channel line drawn parallel to rising resistance. |
| Graphic provided by: StockCharts.com. |
| |
| The weekly chart of the S&P 500 (Figure 4) has also recently had some very bearish events with prices reversing hard off the primary trendline, while the moving average convergence/divergence (MACD) histogram dipped below its centerline. When the histogram moves below the zero line, it identifies that the bears are becoming a stronger, more dominating force. This suggests that the S&P 500 is in the early stages of a major correction. As long as prices and the MACD histogram continue to move in the same direction, it will confirm the downtrend. Should the H&S top pattern in a daily time frame tag the minimum target of 910, it would result in a test to the neckline of the inverse head & shoulders pattern on the weekly chart to the 875-900 area (Figure 4). Figure 4 shows a parallel line drawn with rising resistance on the weekly chart that forms a speculative channel. The speculative lower channel line (gray line) intersects with the neckline of the inverse H&S top pattern and the horizontal support that marked the low of the right shoulder. In geometry, when three or more lines intersect at a single point, they are said to be concurrent. This will be an area of crucial support if this turns out to be a deep correction. If the S&P 500 slips below this support zone, there is one last safety net of support left. That is the closing low that was made while the left shoulder formed on the weekly chart's inverse head & shoulders pattern. That comes in at about 800. There is a very thin amount of support at that level, and if it was penetrated, the consequences would result in a test of the March lows. |
Ron Walker is an active trader and technical analyst. He operates an educational website dedicated to the study of Technical Analysis. The website offers free market analysis with daily video presentations and written commentaries. Ron is a video pioneer, being one of the first to utilize the internet producing Technical Analysis videos. His website is thechartpatterntrader.com
| Website: | thechartpatterntrader.com |
| E-mail address: | thechartpatterntrader@gmail.com |
Click here for more information about our publications!
Comments

Request Information From Our Sponsors
- VectorVest, Inc.
- Executive Premier Workshop
- One-Day Options Course
- OptionsPro
- Retirement Income Workshop
- Sure-Fire Trading Systems (VectorVest, Inc.)
- Trading as a Business Workshop
- VectorVest 7 EOD
- VectorVest 7 RealTime/IntraDay
- VectorVest AutoTester
- VectorVest Educational Services
- VectorVest OnLine
- VectorVest Options Analyzer
- VectorVest ProGraphics v6.0
- VectorVest ProTrader 7
- VectorVest RealTime Derby Tool
- VectorVest Simulator
- VectorVest Variator
- VectorVest Watchdog
- StockCharts.com, Inc.
- Candle Patterns
- Candlestick Charting Explained
- Intermarket Technical Analysis
- John Murphy on Chart Analysis
- John Murphy's Chart Pattern Recognition
- John Murphy's Market Message
- MurphyExplainsMarketAnalysis-Intermarket Analysis
- MurphyExplainsMarketAnalysis-Visual Analysis
- StockCharts.com
- Technical Analysis of the Financial Markets
- The Visual Investor
