HOT TOPICS LIST
- MACD
- Fibonacci
- RSI
- Gann
- ADXR
- Stochastics
- Volume
- Triangles
- Futures
- Cycles
- Volatility
- ZIGZAG
- MESA
- Retracement
- Aroon
INDICATORS LIST
LIST OF TOPICS
PRINT THIS ARTICLE
by Chaitali Mohile
The corrective rally of the gold & silver index has breached its trendline support. Will the index establish support or plunge further?
Position: N/A
Chaitali Mohile
Active trader in the Indian stock markets since 2003 and a full-time writer. Trading is largely based upon technical analysis.
PRINT THIS ARTICLE
BULL/BEAR MARKET
Gold & Silver Index Enters Fresh Downtrend?
02/01/10 01:21:22 PMby Chaitali Mohile
The corrective rally of the gold & silver index has breached its trendline support. Will the index establish support or plunge further?
Position: N/A
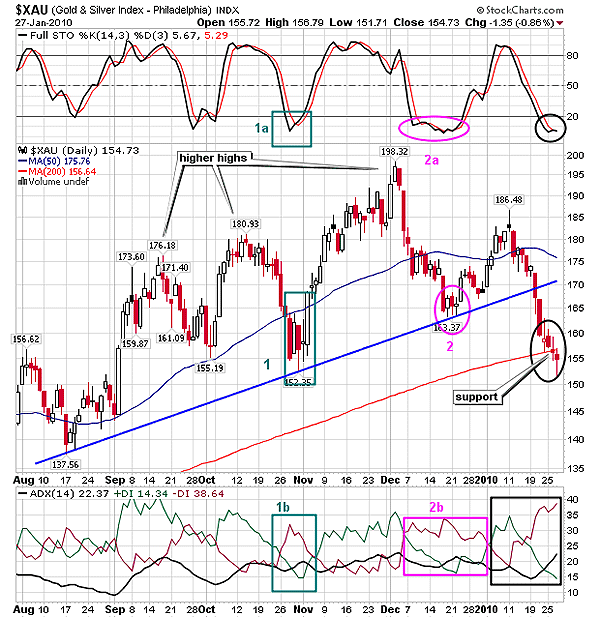
| Since August 2009, the bullish rally of the Philadelphia gold & silver index ($XAU) has been very volatile. After every higher peak, the index corrected and formed a higher bottom. You can draw an ascending trendline by connecting all the higher bottoms. This trendline acts as a support for the rally. In Figure 1, one such trendline is drawn, and note that $XAU has bounced with the support of the trendline. The areas marked as 1, 1a, 1b, and 2, 2a, 2b in Figure 1 shows the price rally and the indicator status during the pullback rally from the trendline support. When the trendline support was challenged earlier (see no. 1), the full stochastic (14,3,3) was oversold (1a) and the selling pressure, reflected by the negative directional index (-DI), descended while the average directional index (ADX) (14) was weak (see 1b). The index surged along as did the stochastic oscillator and the buying pressure. The rally turned stronger, forming higher highs. Because of the high volatility of the rally, the indicators failed to sustain in healthy bullish areas. Thus, the overbought stochastic reversed and the buying pressure declined in Figure 1. |

|
| FIGURE 1: $XAU, DAILY. Due to developing downtrend, the index is likely to sustain below the 200-day MA resistance. |
| Graphic provided by: StockCharts.com. |
| |
| Therefore, $XAU retraced and formed another higher bottom that is our second trendline support (no. 2 in Figure 1). Once again, the full stochastic (14,3,3) was oversold (2a) and the selling pressure shrank (2b). The major difference in the situation was that both indicators sustained in particular areas for a few weeks and later changed direction. As a result, the pullback rally formed a lower peak above the 50-day moving average (MA) resistance. This indicated weakness in the index. |
| Soon $XAU corrected, and the bearish pressure was stronger than earlier conditions. The trendline support was breached for the first time, and the index continued drifting lower. This was the first robust bearish indication by the index. The 200-day MA support was under threat as the price dropped further. The full stochastic (14,3,3) is oversold and shows the possibility of reversing, but we need to stay watchful till the indicator actually surges above 20 levels. The selling pressure -DI has been traveling vertically upward. The significant increase in the selling pressure dragged the ADX (14) above 20 levels, developing a downtrend. Immediately, $XAU breached the robust support of the 200-day MA and entered an intermediate downtrend. Currently, the index is under the newly formed 200-day MA resistance. In addition, the ADX (14) has reached 22 levels, suggesting the developing downtrend. |
| Thus, $XAU is likely to plunge some more levels. Those already short can carry their positions; however, opening fresh short positions might prove risky, as the index has traveled down a long way. Under the 200-day MA resistance, the index might turn more volatile. |
Active trader in the Indian stock markets since 2003 and a full-time writer. Trading is largely based upon technical analysis.
| Company: | Independent |
| Address: | C1/3 Parth Indraprasth Towers. Vastrapur |
| Ahmedabad, Guj 380015 | |
| E-mail address: | chaitalimohile@yahoo.co.in |
Traders' Resource Links | |
| Independent has not added any product or service information to TRADERS' RESOURCE. | |
Click here for more information about our publications!
PRINT THIS ARTICLE

Request Information From Our Sponsors
- StockCharts.com, Inc.
- Candle Patterns
- Candlestick Charting Explained
- Intermarket Technical Analysis
- John Murphy on Chart Analysis
- John Murphy's Chart Pattern Recognition
- John Murphy's Market Message
- MurphyExplainsMarketAnalysis-Intermarket Analysis
- MurphyExplainsMarketAnalysis-Visual Analysis
- StockCharts.com
- Technical Analysis of the Financial Markets
- The Visual Investor
- VectorVest, Inc.
- Executive Premier Workshop
- One-Day Options Course
- OptionsPro
- Retirement Income Workshop
- Sure-Fire Trading Systems (VectorVest, Inc.)
- Trading as a Business Workshop
- VectorVest 7 EOD
- VectorVest 7 RealTime/IntraDay
- VectorVest AutoTester
- VectorVest Educational Services
- VectorVest OnLine
- VectorVest Options Analyzer
- VectorVest ProGraphics v6.0
- VectorVest ProTrader 7
- VectorVest RealTime Derby Tool
- VectorVest Simulator
- VectorVest Variator
- VectorVest Watchdog
