HOT TOPICS LIST
- MACD
- Fibonacci
- RSI
- Gann
- ADXR
- Stochastics
- Volume
- Triangles
- Futures
- Cycles
- Volatility
- ZIGZAG
- MESA
- Retracement
- Aroon
INDICATORS LIST
LIST OF TOPICS
PRINT THIS ARTICLE
by Koos van der Merwe
All you hear and read nowadays is that the market is in a bear correction and it will test the low reached in March 2009, if not fall even lower. Here's why I believe otherwise.
Position: Buy
Koos van der Merwe
Has been a technical analyst since 1969, and has worked as a futures and options trader with First Financial Futures in Johannesburg, South Africa.
PRINT THIS ARTICLE
ELLIOTT WAVE
Why I Am Not A Bear
01/29/10 09:26:33 AMby Koos van der Merwe
All you hear and read nowadays is that the market is in a bear correction and it will test the low reached in March 2009, if not fall even lower. Here's why I believe otherwise.
Position: Buy
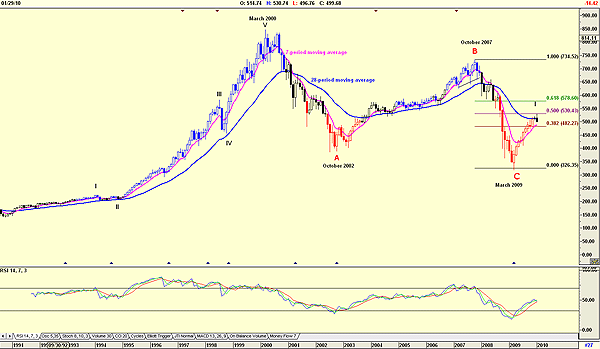
| Being a contrarian is not easy. Whether it is politics causing the market to correct or the yuan or President Barack Obama's State of the Union address, bears will look for any excuse to tank the market. I read newsletters and listen to CNBC talking to bears like Robert Prechter of Elliott wave fame. I simply go back to studying my charts, and I simply cannot see what they are predicting. So once again I must tell you what I see. Figure 1 is a monthly chart of the Standard & Poor's 100. |

|
| FIGURE 1: S&P 100, MONTHLY |
| Graphic provided by: AdvancedGET. |
| |
| Whatever the bears like Robert Prechter say, I still believe that the low of March 2009 was the C-wave bottom. Just a simple look at Figure 1 shows this. The chart shows the ABC correction ended in March 2009. Since then, the index has risen in a Wave I, which has reached a high of 530.43, a 50% retracement of the fall of Wave C. The chart shows two moving averages, a short-term seven-period exponential moving average (EMA), and a 28-period EMA. The index is above the seven-period moving average and testing the 28-period moving average. However, the relative strength index (RSI) is still bullish, suggesting that although there may be a correction, it will be a mild one. To see how mild, we must look at a daily chart (Figure 2). |

|
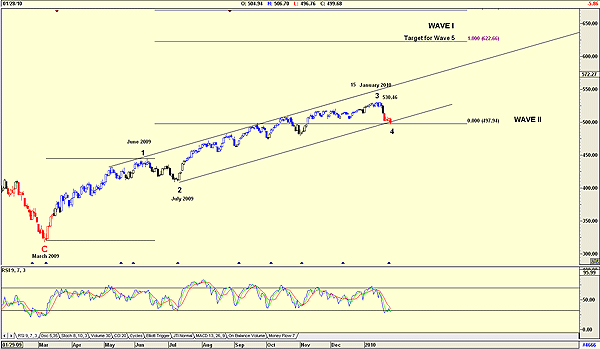
| FIGURE 2: S&P 100, DAILY |
| Graphic provided by: AdvancedGET. |
| |
| Figure 2 shows that the Wave I correction suggested in Figure 1 has only completed wave 4, with a fifth wave to follow. The chart suggests that wave 5 of Wave I should reach a high of 622.26. This figure is a guesstimate, because wave 5 should be equal to wave 1. Unfortunately, wave 5 can be less or greater than wave 1, but we do know that the nine-period RSI has suggested a buy signal. Yes, there will be a correction, and possibly a 20% one at that. That will be with Wave II when Wave I is completed at the target of 622.66, if it does reach there and when it reaches there. The Wave II correction will fall to somewhere in Wave 4, the correction in the previous impulse wave. Assuming it reaches its target of 622 and then falls as low as 500, then 622 - 500 = 122/622 is 20%. So who do you believe, the bears on the television who are running with the wind and coming up with any story to justify that wind, or your charts? You decide. Me? I go with my charts, and yes, there will be a correction, at a guess with the "Sell in May..." maxim, but at the moment, I am still bullish. |
Has been a technical analyst since 1969, and has worked as a futures and options trader with First Financial Futures in Johannesburg, South Africa.
| Address: | 3256 West 24th Ave |
| Vancouver, BC | |
| Phone # for sales: | 6042634214 |
| E-mail address: | petroosp@gmail.com |
Click here for more information about our publications!
Comments
Date: 02/02/10Rank: 5Comment: Koos:
I believe you!
Good work,
Dick

Request Information From Our Sponsors
- StockCharts.com, Inc.
- Candle Patterns
- Candlestick Charting Explained
- Intermarket Technical Analysis
- John Murphy on Chart Analysis
- John Murphy's Chart Pattern Recognition
- John Murphy's Market Message
- MurphyExplainsMarketAnalysis-Intermarket Analysis
- MurphyExplainsMarketAnalysis-Visual Analysis
- StockCharts.com
- Technical Analysis of the Financial Markets
- The Visual Investor
- VectorVest, Inc.
- Executive Premier Workshop
- One-Day Options Course
- OptionsPro
- Retirement Income Workshop
- Sure-Fire Trading Systems (VectorVest, Inc.)
- Trading as a Business Workshop
- VectorVest 7 EOD
- VectorVest 7 RealTime/IntraDay
- VectorVest AutoTester
- VectorVest Educational Services
- VectorVest OnLine
- VectorVest Options Analyzer
- VectorVest ProGraphics v6.0
- VectorVest ProTrader 7
- VectorVest RealTime Derby Tool
- VectorVest Simulator
- VectorVest Variator
- VectorVest Watchdog
