HOT TOPICS LIST
- MACD
- Fibonacci
- RSI
- Gann
- ADXR
- Stochastics
- Volume
- Triangles
- Futures
- Cycles
- Volatility
- ZIGZAG
- MESA
- Retracement
- Aroon
INDICATORS LIST
LIST OF TOPICS
PRINT THIS ARTICLE
by Donald W. Pendergast, Jr.
Canadian dollar futures enjoyed a nice bull run in 2009, but the technicals now suggest that it may take a while for the loonie to meet or exceed its October 2009 highs.
Position: N/A
Donald W. Pendergast, Jr.
Donald W. Pendergast is a financial markets consultant who offers specialized services to stock brokers and high net worth individuals who seek a better bottom line for their portfolios.
PRINT THIS ARTICLE
CYCLES
Canadian Dollar Futures Descending Toward Support
01/29/10 09:00:31 AMby Donald W. Pendergast, Jr.
Canadian dollar futures enjoyed a nice bull run in 2009, but the technicals now suggest that it may take a while for the loonie to meet or exceed its October 2009 highs.
Position: N/A
| The only nice thing about a bear market is that there's always a bull market destined to follow in its wake, and perhaps that was the general feeling among long-position holders of Canadian dollar (CAD)–denominated assets during the long decline that commenced in November 2007. The loonie dropped all the way from 1.104 to 0.7635, finally making a lasting low in early March 2009. CAD futures then embarked on a seven-month-long bull rally, rising by more than 28%. Since October 2009, however, the recent swing high failed to take out October's high at 0.9798, causing a sharp selloff to occur. Will the loonie be able to recover and mount another attempt at the October swing high, or is a larger-degree decline in the cards for this major global currency? The weekly and daily charts may offer some useful clues, as always. |

|
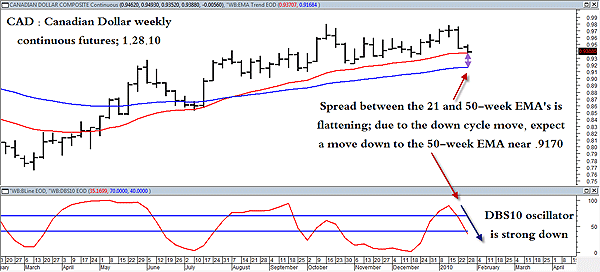
| FIGURE 1: CAD, WEEKLY. With a very reliable cyclical indicator suggesting lower prices ahead, the 50-day EMA (blue line) near 0.9200 may still offer some support. |
| Graphic provided by: MetaStock. |
| Graphic provided by: WB DBS10 EOD from ProfitTrader for Metastock. |
| |
| Figure 1 is the weekly chart — note the sideways action in the loonie since making that high in October 2009. In addition, the WB DBS10 oscillator (the red indicator at the bottom of this chart) does a fantastic job of calling cycle tops and bottoms, especially when they're in the direction of the dominant trend falling rapidly, suggesting that the CAD should easily make it to the 50-week exponential moving average (EMA) support level in this particular weekly swing move. The spread between the 21-week (red line) and 50-week EMA (blue line) has also flattened, confirming the previous period of consolidation. Now let's get more specific with an examination of the CAD daily graph. |

|
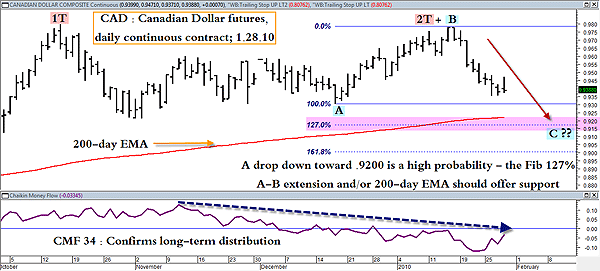
| FIGURE 2: CAD, DAILY. If the CAD breaks below swing point A, expect a swift move toward major support between 0.9215 and 0.9175, the location of the 200-day EMA, and the Fibonacci A-B 127% expansion level. |
| Graphic provided by: MetaStock. |
| |
| One of the most important technical features on Figure 2 is the double-top formation (labeled as "1T" and "2T," respectively). January's swing high came within a few ticks of meeting the October high, but apparently most traders simply shrugged and said to themselves, "Close, but no cigar." The CAD is still in the downward move that resulted from that particular failure swing, but there are three significant areas of support that may help tone down the sharp rate of descent in this commodity currency. They are: 1. The November/December swing lows, near 0.9301/0.9303 2. The 200-day EMA, near 0.9212 3. The Fibonacci A-B 127% extension ratio near 0.9175 As we already know, the weekly cycle is falling sharply, so there is a high probability that these support levels will be hit, most likely within the next few weeks. The US dollar's rally also appears to be the real deal, and as the CAD and US dollar generally move in inverse fashion, this is another powerful confirming factor that warns of further weakness in the loonie. |
| Playing the down cycle in the CAD offers some interesting choices in the option market; right now, you can sell a June 2010 0.8300 CAD put option for about 0.0034 or $340 before commissions. The option trades on the CME (Chicago Mercantile Exchange) and expires on June 4, 2010, a little more than four months from now. Here's a basic plan for those who are moderately bearish on the CAD between now and early June: Sell 1 June 2010 0.8300 CAD put option for 0.0060 ($600) or better, but only if the currency bottoms and begins to turn higher at a price level of 0.9000 or higher. There is a very significant chart support level at 0.8530, the July 2009 weekly swing low, and this should offer a reasonably good level of protection for this far out-of-the-money, deferred-month short option sale. As always, if you see the CAD drop sharply after you sell your put (per guidelines) and the option doubles in price, simply buy it back (buy to cover) before the situation gets out of hand. On the other hand, if the CAD does manage to make a solid low somewhere between 0.9000 and 0.9200 and then begins to retrace some of the recent losses, your short put will lose plenty of deltas (as it moves away from its 0.8300 strike price) even as it sheds ever-increasing amounts of time value. So your job now is to simply keep an eye on the area between 0.9000 and 0.9200 to see if the CAD can find a base from which to launch higher in the weeks ahead. It may take a bit of faith and a good understanding of price cycles to time the perfect fill on this particular option sale, but since this is a long-term, way out-of-the-money option, you should still be able to obtain an attractive premium even if you're off a bit on your timing. |
Donald W. Pendergast is a financial markets consultant who offers specialized services to stock brokers and high net worth individuals who seek a better bottom line for their portfolios.
| Title: | Writer, market consultant |
| Company: | Linear Trading Systems LLC |
| Jacksonville, FL 32217 | |
| Phone # for sales: | 904-239-9564 |
| E-mail address: | lineartradingsys@gmail.com |
Traders' Resource Links | |
| Linear Trading Systems LLC has not added any product or service information to TRADERS' RESOURCE. | |
Click here for more information about our publications!
Comments

Request Information From Our Sponsors
- VectorVest, Inc.
- Executive Premier Workshop
- One-Day Options Course
- OptionsPro
- Retirement Income Workshop
- Sure-Fire Trading Systems (VectorVest, Inc.)
- Trading as a Business Workshop
- VectorVest 7 EOD
- VectorVest 7 RealTime/IntraDay
- VectorVest AutoTester
- VectorVest Educational Services
- VectorVest OnLine
- VectorVest Options Analyzer
- VectorVest ProGraphics v6.0
- VectorVest ProTrader 7
- VectorVest RealTime Derby Tool
- VectorVest Simulator
- VectorVest Variator
- VectorVest Watchdog
- StockCharts.com, Inc.
- Candle Patterns
- Candlestick Charting Explained
- Intermarket Technical Analysis
- John Murphy on Chart Analysis
- John Murphy's Chart Pattern Recognition
- John Murphy's Market Message
- MurphyExplainsMarketAnalysis-Intermarket Analysis
- MurphyExplainsMarketAnalysis-Visual Analysis
- StockCharts.com
- Technical Analysis of the Financial Markets
- The Visual Investor
