HOT TOPICS LIST
- MACD
- Fibonacci
- RSI
- Gann
- ADXR
- Stochastics
- Volume
- Triangles
- Futures
- Cycles
- Volatility
- ZIGZAG
- MESA
- Retracement
- Aroon
INDICATORS LIST
LIST OF TOPICS
PRINT THIS ARTICLE
by Alan R. Northam
Now that Apple has launched its new iPad, how will this affect the future price of Apple?
Position: N/A
Alan R. Northam
Alan Northam lives in the Dallas, Texas area and as an electronic engineer gave him an analytical mind from which he has developed a thorough knowledge of stock market technical analysis. His abilities to analyze the future direction of the stock market has allowed him to successfully trade of his own portfolio over the last 30 years. Mr. Northam is now retired and trading the stock market full time. You can reach him at inquiry@tradersclassroom.com or by visiting his website at http://www.tradersclassroom.com. You can also follow him on Twitter @TradersClassrm.
PRINT THIS ARTICLE
ANDREWS PITCH-FORK
iPad And The Price Of Apple Inc.
01/28/10 08:56:21 AMby Alan R. Northam
Now that Apple has launched its new iPad, how will this affect the future price of Apple?
Position: N/A
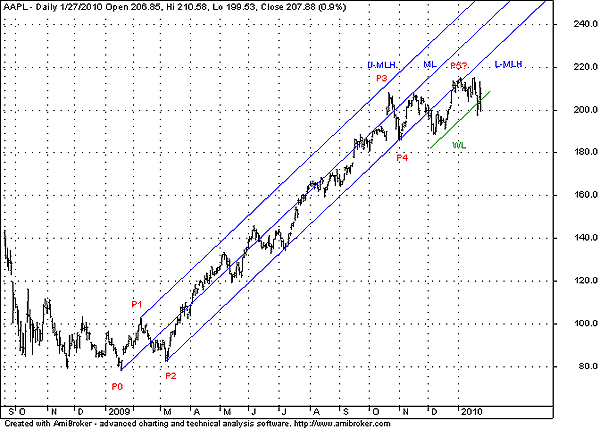
| I saw my first advertisement on TV about the new Apple iPad. My immediate thought was, "How will the introduction of the iPad affect Apple's stock price?" So I decided to take a look at the stock. Figure 1 shows the daily price chart of Apple (AAPL). I have identified the significant pivot points and drawn the Andrews pitchfork. I then realized that price remained within the limits of the pitchfork until after pivot point P4 was formed. After P4, APPL moved up to the median line (ML) just like Alan Hall Andrews said it should. Price then bounced off the median line and reversed back down, just like Alan Andrews said it should. Andrews recognized that 80% of the time when price reached the median line, it would reverse direction. |

|
| FIGURE 1: AAPL, DAILY. The Andrews pitchfork can be seen here. |
| Graphic provided by: AmiBroker.com. |
| |
| After reversing direction, AAPL broke down below the lower line of the pitchfork labeled L-MLH, which stands for "lower-median line horizontal." The breakdown of the L-MLH calls for adding a warning line to the chart. Warning lines are the next lower price level, at which price should reverse back up. For now, price continues to respect this reversal line, indicating that price should reverse back to the upside. |
| I have also added P5 to the chart but with a question mark. Typically, P5 forms once price reaches the median line of the pitchfork, but with the breakdown below the pitchfork, I am concerned that perhaps price is too weak to make it back up to the median line. Therefore, I have zoomed in on the last three months of the price chart and added a new pitchfork to better study price action. |
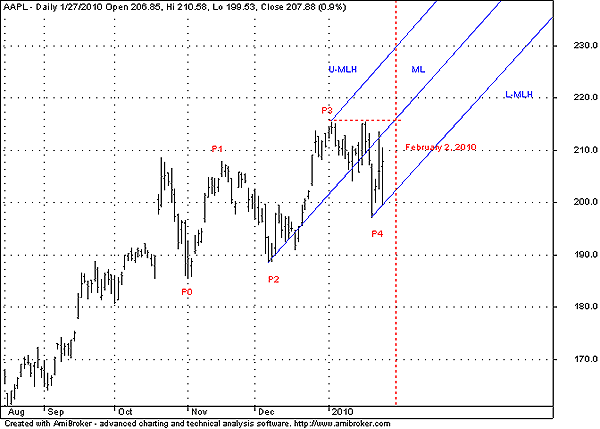
| To further study the price action of AAPL, I have zoomed in on the last three months of price action to better study price action. I have added P0 where P4 was in Figure 1 and labeled the pivot points P1, P2, P3, and P4. I have also drawn in a new pitchfork off P2 through P4 to find the area where P5 should form, as Alan Andrews would have done. The final pivot point P5 of the uptrend should form in the area of the median line and higher than the price level of P3 (Figure 2). This means that the upward trend for AAPL could end some time after the beginning of February. I have added some dotted lines to give a sense of timing. |

|
| FIGURE 2: AAPL, DAILY. This chart shows the stock over the last four months. This chart shows the Andrews pitchfork drawn off pivot points P2, P3, and P4 to find the area in which P5 should develop. |
| Graphic provided by: AmiBroker.com. |
| |
| Alan Andrews recognized that after five significant pivot points a market would reverse directions. Figure 1 shows that all the significant pivot points have been identified, with the possible exception that the final P5 significant pivot point may not have yet developed. Figure 2 shows a closer look at the last three months of trading. It too shows that all pivot points with the exception of the final pivot point P5 have formed to complete the upward rally. Therefore, it looks like this market is very close to reversing directions from up to down and it has already factored in the launch of the new iPad. |
Alan Northam lives in the Dallas, Texas area and as an electronic engineer gave him an analytical mind from which he has developed a thorough knowledge of stock market technical analysis. His abilities to analyze the future direction of the stock market has allowed him to successfully trade of his own portfolio over the last 30 years. Mr. Northam is now retired and trading the stock market full time. You can reach him at inquiry@tradersclassroom.com or by visiting his website at http://www.tradersclassroom.com. You can also follow him on Twitter @TradersClassrm.
| Garland, Tx | |
| Website: | www.tradersclassroom.com |
| E-mail address: | inquiry@tradersclassroom.com |
Click here for more information about our publications!
PRINT THIS ARTICLE

Request Information From Our Sponsors
- StockCharts.com, Inc.
- Candle Patterns
- Candlestick Charting Explained
- Intermarket Technical Analysis
- John Murphy on Chart Analysis
- John Murphy's Chart Pattern Recognition
- John Murphy's Market Message
- MurphyExplainsMarketAnalysis-Intermarket Analysis
- MurphyExplainsMarketAnalysis-Visual Analysis
- StockCharts.com
- Technical Analysis of the Financial Markets
- The Visual Investor
- VectorVest, Inc.
- Executive Premier Workshop
- One-Day Options Course
- OptionsPro
- Retirement Income Workshop
- Sure-Fire Trading Systems (VectorVest, Inc.)
- Trading as a Business Workshop
- VectorVest 7 EOD
- VectorVest 7 RealTime/IntraDay
- VectorVest AutoTester
- VectorVest Educational Services
- VectorVest OnLine
- VectorVest Options Analyzer
- VectorVest ProGraphics v6.0
- VectorVest ProTrader 7
- VectorVest RealTime Derby Tool
- VectorVest Simulator
- VectorVest Variator
- VectorVest Watchdog
