HOT TOPICS LIST
- MACD
- Fibonacci
- RSI
- Gann
- ADXR
- Stochastics
- Volume
- Triangles
- Futures
- Cycles
- Volatility
- ZIGZAG
- MESA
- Retracement
- Aroon
INDICATORS LIST
LIST OF TOPICS
PRINT THIS ARTICLE
by Austin Passamonte
Having an exit strategy is a crucial aspect of investing and trading.
Position: N/A
Austin Passamonte
Austin is a private trader who trades emini stock index futures intraday. He currently trades various futures markets from home in addition to managing a trader's educational forum
PRINT THIS ARTICLE
STRATEGIES
Lucent, Enron, Etc: Could Losses Have Been Prevented?
11/28/01 10:27:07 AMby Austin Passamonte
Having an exit strategy is a crucial aspect of investing and trading.
Position: N/A
| Countless disasters in the stock market literally stripped trillions of dollars from equity investor's net worth. Most simply shrugged this tragedy off as inevitable or incurable, but is it? Could learned investors and traders spot clear warning signs, heed them accordingly and survive with capital intact if not outright prosper? |
| Lucent Technologies was one of the biggest disasters we've seen to date. It was and still remains one of the widest-held shares among investors, which means maximum damage was done upon its price collapse. Totally unnecessary to ride this loser down-- this never happened to savvy players. |

|
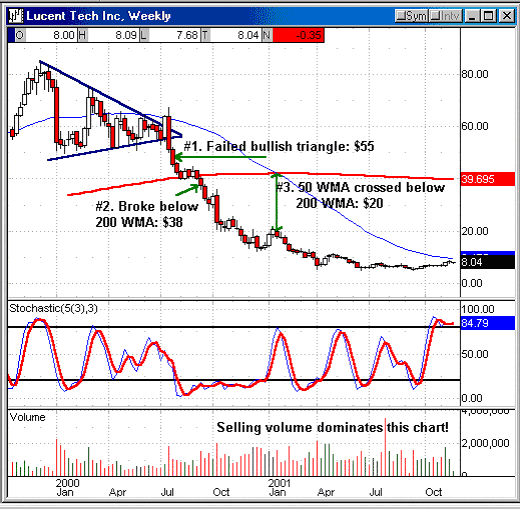
| Figure 1: Weekly Chart: Lucent Techologies [LU] |
| Graphic provided by: Quote.com. |
| Graphic provided by: Qcharts. |
| |
| The first sign of a major warning came in June/July 2000 when the long-term bullish ascending triangle broke out to the upside for one week and promptly reversed to break lower instead. That failure is very bearish in nature and should have red-flagged everyone who watches for simple chart patterns to form. Confirmation of the failure came near LU's $55 area. The second warning arrived in September when it then broke below the 200-week moving average near the $38 range. This is a weak market and getting worse! Look at that volume: Dominated by selling (red lines). A third & final warning came in January 2001 when the 50-week moving average crossed below the 200-week moving average as the stock traded near $20. Investors who rode it down through the first two warning signs thought that it was too low to sell at $20, but we wonder how such an offer for remaining shares would be viewed today? Is it ever too late to sell? Maybe, but not at the three screaming danger zones observed in this chart. |
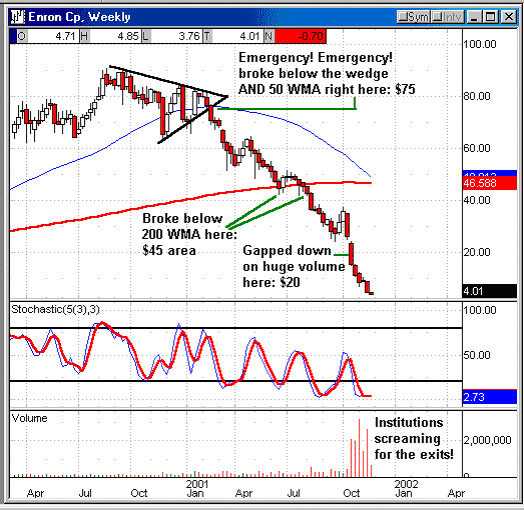
 Figure 2: Weekly Chart: Enron [ERE] Lest we thought this could never happen again, think again. Refusal to sell while riding plummeting stocks to devastating loss is inherent human nature reinforced by the "buy & hold for the long haul" crowd. Being in for the long haul is by no means a guarantee for success as too many have painfully learned the hard way. Early this spring we saw Enron break below its 50-week moving average that also violated one version of a long-term wedge. It did so with a large-range week demonstrated by the long red candle of descent. The $70 to $75 area could have been easily protected by longs and never suffered further loss from there. Those who didn't heed such early warning had a second rescue ship come around a couple months later when price action broke below its 200-week moving average. It did so twice near the $45 range, another area to exit or protect. The final slide from $35 to $20 offered numerous warning bells & whistles. Price action formed a bearish expanding wedge (not drawn) that ended with a gap-down week on huge volume as major players rushed for the exit. Too many retail traders mistakenly believed $20 was too cheap to sell and some even bought more to "average down" their higher cost. Ouch! |
| Defense Wins Championships No investor or trader should ever buy a single share without clear exit plans in mind. No investment should ever lay exposed to massive ruin without several plans to exit or hedge. Traders and investors could have easily sold each of these stocks at far higher prices than where they trade today. They could have bought puts for protection that would have negated all loss. They could have even sold covered calls and bought more puts that would have resulted in NET PROFIT on the decline of each. But most investors didn't do any of these simple measures and withstood painful loss instead. Does it have to be this way next time? To be forewarned is forearmed, and rest assured many will watch their charts more carefully next time for clear signs of cracks in the dam. |
Austin is a private trader who trades emini stock index futures intraday. He currently trades various futures markets from home in addition to managing a trader's educational forum
| Title: | Individual Trader |
| Company: | CoiledMarkets.com |
| Address: | PO Box 633 |
| Naples, NY 14512 | |
| Website: | coiledmarkets.com/blog |
| E-mail address: | austinp44@yahoo.com |
Traders' Resource Links | |
| CoiledMarkets.com has not added any product or service information to TRADERS' RESOURCE. | |
Click here for more information about our publications!
Comments
Date: 12/04/01Rank: 5Comment:
Date: 12/04/01Rank: 5Comment:
Date: 12/04/01Rank: 4Comment:
Date: 12/06/01Rank: 4Comment:
Date: 12/09/01Rank: 5Comment: Helpful article. I am finding that it is much easier to buy, and much more difficult to burn into my mind-set the tools available. I ll have to get my feet wet!
Date: 12/11/01Rank: 5Comment:

Request Information From Our Sponsors
- StockCharts.com, Inc.
- Candle Patterns
- Candlestick Charting Explained
- Intermarket Technical Analysis
- John Murphy on Chart Analysis
- John Murphy's Chart Pattern Recognition
- John Murphy's Market Message
- MurphyExplainsMarketAnalysis-Intermarket Analysis
- MurphyExplainsMarketAnalysis-Visual Analysis
- StockCharts.com
- Technical Analysis of the Financial Markets
- The Visual Investor
- VectorVest, Inc.
- Executive Premier Workshop
- One-Day Options Course
- OptionsPro
- Retirement Income Workshop
- Sure-Fire Trading Systems (VectorVest, Inc.)
- Trading as a Business Workshop
- VectorVest 7 EOD
- VectorVest 7 RealTime/IntraDay
- VectorVest AutoTester
- VectorVest Educational Services
- VectorVest OnLine
- VectorVest Options Analyzer
- VectorVest ProGraphics v6.0
- VectorVest ProTrader 7
- VectorVest RealTime Derby Tool
- VectorVest Simulator
- VectorVest Variator
- VectorVest Watchdog
