HOT TOPICS LIST
- MACD
- Fibonacci
- RSI
- Gann
- ADXR
- Stochastics
- Volume
- Triangles
- Futures
- Cycles
- Volatility
- ZIGZAG
- MESA
- Retracement
- Aroon
INDICATORS LIST
LIST OF TOPICS
PRINT THIS ARTICLE
by Alan R. Northam
Many methods of technical analysis can be used to determine the future trend of the US dollar. This analysis uses methods developed by Alan Hall Andrews including the use of the Andrews pitchfork.
Position: N/A
Alan R. Northam
Alan Northam lives in the Dallas, Texas area and as an electronic engineer gave him an analytical mind from which he has developed a thorough knowledge of stock market technical analysis. His abilities to analyze the future direction of the stock market has allowed him to successfully trade of his own portfolio over the last 30 years. Mr. Northam is now retired and trading the stock market full time. You can reach him at inquiry@tradersclassroom.com or by visiting his website at http://www.tradersclassroom.com. You can also follow him on Twitter @TradersClassrm.
PRINT THIS ARTICLE
ANDREWS PITCH-FORK
Dollar In Uptrend
01/27/10 09:20:24 AMby Alan R. Northam
Many methods of technical analysis can be used to determine the future trend of the US dollar. This analysis uses methods developed by Alan Hall Andrews including the use of the Andrews pitchfork.
Position: N/A
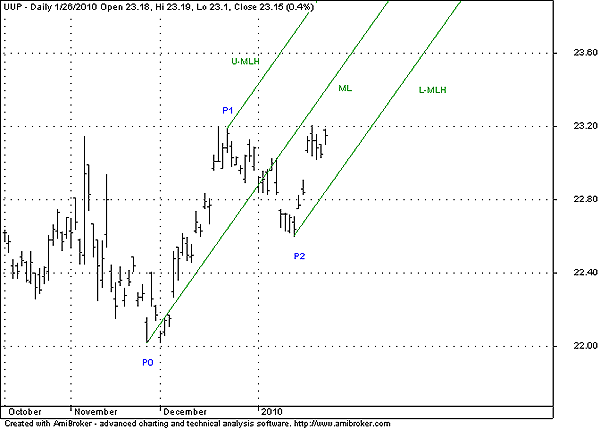
| Figure 1 is that of the PowerShares DB US Dollar exchange traded fund (ETF)(UUP). The first thing that Alan Hall Andrews would do when he picked up a stock chart to analyze was identify the significant pivot points. Figure 1 shows that three significant pivot points have developed. The first significant pivot point was the low made in late November 2009 and is labeled P0. The second significant pivot point developed in mid-December 2009 is labeled P1, and the third significant pivot point developed in mid-January 2010 is labeled P2. Having identified pivot points P1 and P2, Andrews would then expect the market to continue in the same direction to complete pivots P3, P4, and P5 before reversing back down. |

|
| FIGURE 1: UUP, DAILY. This chart shows the first three signficant pivot points labeled P0, P1, and P2 along with the Andrews pitchfork drawn off these three pivots. |
| Graphic provided by: AmiBroker.com. |
| |
| Having identified the first three significant pivot points, Andrews would then draw his pitchfork as shown in Figure 1. He labeled the middle line of the pitchfork as the median line marked as ML on the chart. The line below the median line and parallel to it Andrews labeled as the lower horizontal line to the median line, naming it L-MLH (for "lower median line horizontal"). The line above the median line Andrews labeled U-MLH (for "upper median line horizontal"). Andrews recognized these lines as being horizontal to the median line and did not use the word "parallel." He recognized that the median line acted as a magnet to price and expected price to move up to the median line. Andrews also recognized that once price moved up to the median line 80% of the time, a reversal in trend would occur. However, Andrews also recognized that the reversal does not always occur immediately but that price could move higher along the median line before the reversal actually occurred. Thus, Andrews referred to the area where price touched the median line as the "area where a reversal in trend was expected." |
| From Figure 1, note that price has not yet reached the median line. Therefore, price should continue higher until it reaches the median line. Once the median line is touched, price may reverse immediately or move higher along the median line before reversing back down. This reversal should then identify significant pivot point P3. Price should then move down to the lower line horizontal to the median line labeled L-MLH to form P4. Once P4 is identified, Andrews would draw a new pitchfork to identify the area where P5 could develop. Once P5 was identified, Andrews would then expect a major trend reversal. |
| In conclusion, based upon Alan Andrews' methods of analysis, the dollar is in an uptrend with further to go before a major trend reversal is expected. |
Alan Northam lives in the Dallas, Texas area and as an electronic engineer gave him an analytical mind from which he has developed a thorough knowledge of stock market technical analysis. His abilities to analyze the future direction of the stock market has allowed him to successfully trade of his own portfolio over the last 30 years. Mr. Northam is now retired and trading the stock market full time. You can reach him at inquiry@tradersclassroom.com or by visiting his website at http://www.tradersclassroom.com. You can also follow him on Twitter @TradersClassrm.
| Garland, Tx | |
| Website: | www.tradersclassroom.com |
| E-mail address: | inquiry@tradersclassroom.com |
Click here for more information about our publications!
PRINT THIS ARTICLE

Request Information From Our Sponsors
- StockCharts.com, Inc.
- Candle Patterns
- Candlestick Charting Explained
- Intermarket Technical Analysis
- John Murphy on Chart Analysis
- John Murphy's Chart Pattern Recognition
- John Murphy's Market Message
- MurphyExplainsMarketAnalysis-Intermarket Analysis
- MurphyExplainsMarketAnalysis-Visual Analysis
- StockCharts.com
- Technical Analysis of the Financial Markets
- The Visual Investor
- VectorVest, Inc.
- Executive Premier Workshop
- One-Day Options Course
- OptionsPro
- Retirement Income Workshop
- Sure-Fire Trading Systems (VectorVest, Inc.)
- Trading as a Business Workshop
- VectorVest 7 EOD
- VectorVest 7 RealTime/IntraDay
- VectorVest AutoTester
- VectorVest Educational Services
- VectorVest OnLine
- VectorVest Options Analyzer
- VectorVest ProGraphics v6.0
- VectorVest ProTrader 7
- VectorVest RealTime Derby Tool
- VectorVest Simulator
- VectorVest Variator
- VectorVest Watchdog
