HOT TOPICS LIST
- MACD
- Fibonacci
- RSI
- Gann
- ADXR
- Stochastics
- Volume
- Triangles
- Futures
- Cycles
- Volatility
- ZIGZAG
- MESA
- Retracement
- Aroon
INDICATORS LIST
LIST OF TOPICS
PRINT THIS ARTICLE
by Ron Walker
The McClellan summation index for the NYSE just completed a bearish divergence, and traders got the confirmation as it crossed below the 10-day moving average triggering a bearish signal. Meanwhile, the summation index was also grinding through a bearish head & shoulders topping pattern.
Position: N/A
Ron Walker
Ron Walker is an active trader and technical analyst. He operates an educational website dedicated to the study of Technical Analysis. The website offers free market analysis with daily video presentations and written commentaries. Ron is a video pioneer, being one of the first to utilize the internet producing Technical Analysis videos. His website is thechartpatterntrader.com
PRINT THIS ARTICLE
MCCLELLAN SUMM INDEX
McClellan Summation Index 101 - Divergences
01/26/10 10:59:13 AMby Ron Walker
The McClellan summation index for the NYSE just completed a bearish divergence, and traders got the confirmation as it crossed below the 10-day moving average triggering a bearish signal. Meanwhile, the summation index was also grinding through a bearish head & shoulders topping pattern.
Position: N/A
| In 1969, Sherman and Marian McClellan developed the McClellan oscillator and its companion, the McClellan summation index, to help them improve market timing by spotting major market turning points. Since then, the McClellan summation index has become a popular market breadth indicator. But what is the McClellan summation index? It is the cumulative sum of the daily McClellan oscillator figures. The McClellan oscillator (MO) takes the difference between two exponential moving averages (EMAs) of the daily NYSE advance-decline net values. The MO is the difference between the 19-day and the 39-day exponential moving averages (EMAs) of the daily net advance-decline figures. The MO is a market breadth indicator that helps us evaluate the money flow of the stock market. Its purpose is to help determine if money is entering or exiting the stock market, indicating whether overbought or oversold conditions are present. The formula for the MO is derived by subtracting the 39-day exponential moving average from the 19-day EMA of net advances. |

|
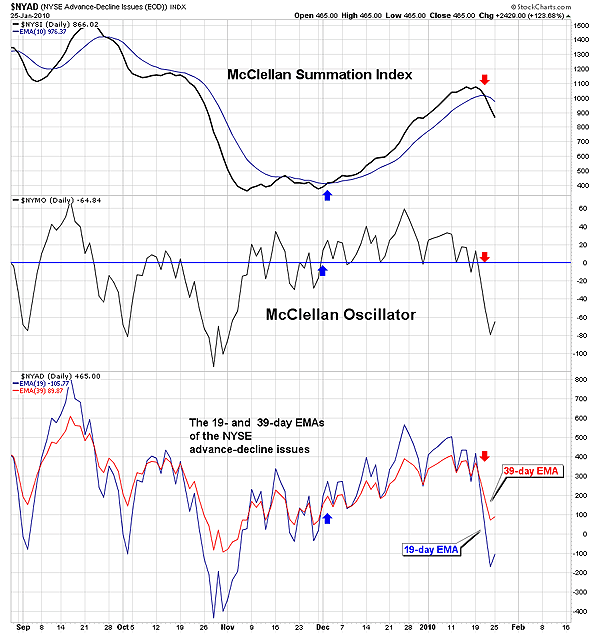
| FIGURE 1: $NYMO & $NYSI, DAILY. Note how the 19-day and 39-day EMA crossovers correspond with zero-line crossovers on the McClellan oscillator. The zero-line crossovers correspond with the summation index rising above and falling below its 10-day EMA. |
| Graphic provided by: StockCharts.com. |
| |
| The MO is plotted vertically and fluctuates between +100 and -100, with zero acting as a median line. When the indicator is above zero, it is a favorable environment for long positions, but when the oscillator hovers below zero it signals that it is a better atmosphere for selling short (see the middle window on Figure 1). When the shorter moving average (19-day EMA) moves above the longer moving average EMA (39-day EMA), it signals that the bulls are gaining momentum as advancing issues increase. This causes the MO to remain above the zero line. In contrast, when the 19-day EMA falls below the 39-day EMA, it signals that declining issues are prevailing and that the bears are in control, causing the MO to hover below zero. The McClellan summation index (MSI) is a long-range version of the McClellan oscillator. It is calculated by adding each day's McClellan oscillator reading to the previous day's summation index reading. There are now two ways of calculating the MO formula, but due to space constraints I will only give the original method. Yesterday's summation index + Today's McClellan oscillator = Today's summation index |
| The MSI fluctuates between positive and negative territory with a median line of zero. A move below zero is undesirable and suggests price weakness. The MSI is better suited for longer position or trend trades, whereas the MO is ideal for providing short-term signals. Figure 1 shows how the McClellan oscillator and the McClellan summation index work. The bottom window shows the 19-day EMA and the 39-day EMA of the NYSE advance-decline issues, and the middle window shows the ratio-adjusted McClellan oscillator line, and in the upper window is the McClellan summation index, which is the cumulative total of the McClellan oscillator. Figure 1 reveals that the 19-day and 39-day EMA crossovers correspond with zero-line crossovers on the McClellan oscillator. |
| Note when the MO moved above its zero line in early December and remained there until mid-January, with the exception of a few abbreviated tests to the zero line, that move coincided with the MSI rising above its 10-day EMA for an extended period. See Figure 2. |

|
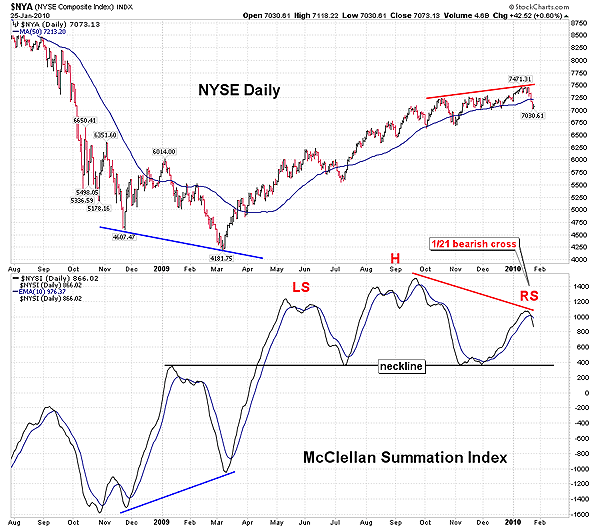
| FIGURE 2: $NYA & $NYSI, DAILY. Just as a bullish divergence completed in early 2009 between the NYSE and the McClellan summation index marking a bottom, the recent bearish divergence is likely carving out a top. The recent peak completed a higher high and the right shoulder of a head & shoulders topping pattern. |
| Graphic provided by: StockCharts.com. |
| |
| Like other market breadth indicators, the McClellan summation index can form trendlines, divergences, and chart patterns. Sherman McClellan suggests looking for tops when divergences develop with the market. Figure 2 reveals that such a divergence occurred in January with the daily chart of the New York Stock Exchange (NYSE). Notice that it was a bullish divergence in late 2008 to early 2009 that created the March bottom in the market. During November the MSI tested the lows made during the summer correction, but then surged in December, forming a potential neckline for a head and shoulders top pattern. The MSI continued to rise until January, where a lower peak formed, completing a bearish divergence and creating a potential right shoulder (Figure 2). If the MSI falls back and declines below the clearly seen level of support just below +400, the head and shoulders pattern will play out. With the bearish forces of the divergence at work, there is a high probability that head and shoulders top will run its course. The bearish divergence, the MSI bearish crossover below its 10-day EMA, and the head and shoulders top all forewarn that the market is likely in the early stages of a major correction. If the Summation Index moves below the neckline of the pattern, it very well may be headed back below the zero line. That would be an extremely bearish sign. |
Ron Walker is an active trader and technical analyst. He operates an educational website dedicated to the study of Technical Analysis. The website offers free market analysis with daily video presentations and written commentaries. Ron is a video pioneer, being one of the first to utilize the internet producing Technical Analysis videos. His website is thechartpatterntrader.com
| Website: | thechartpatterntrader.com |
| E-mail address: | thechartpatterntrader@gmail.com |
Click here for more information about our publications!
Comments
Date: 01/26/10Rank: 1Comment:
Date: 05/19/14Rank: 5Comment:

Request Information From Our Sponsors
- StockCharts.com, Inc.
- Candle Patterns
- Candlestick Charting Explained
- Intermarket Technical Analysis
- John Murphy on Chart Analysis
- John Murphy's Chart Pattern Recognition
- John Murphy's Market Message
- MurphyExplainsMarketAnalysis-Intermarket Analysis
- MurphyExplainsMarketAnalysis-Visual Analysis
- StockCharts.com
- Technical Analysis of the Financial Markets
- The Visual Investor
- VectorVest, Inc.
- Executive Premier Workshop
- One-Day Options Course
- OptionsPro
- Retirement Income Workshop
- Sure-Fire Trading Systems (VectorVest, Inc.)
- Trading as a Business Workshop
- VectorVest 7 EOD
- VectorVest 7 RealTime/IntraDay
- VectorVest AutoTester
- VectorVest Educational Services
- VectorVest OnLine
- VectorVest Options Analyzer
- VectorVest ProGraphics v6.0
- VectorVest ProTrader 7
- VectorVest RealTime Derby Tool
- VectorVest Simulator
- VectorVest Variator
- VectorVest Watchdog
