HOT TOPICS LIST
- MACD
- Fibonacci
- RSI
- Gann
- ADXR
- Stochastics
- Volume
- Triangles
- Futures
- Cycles
- Volatility
- ZIGZAG
- MESA
- Retracement
- Aroon
INDICATORS LIST
LIST OF TOPICS
PRINT THIS ARTICLE
by Ron Walker
The health care exchange traded fund has recently had an explosive move higher as the politicians battle it out over health care. Even though there is no bipartisan support for the health care bill, there has been bipartisan support among investors to run up the health care ETF. But with the most recent thrust upward, and speculation about the bill dying, traders might be wise to apply the old strategy of "Buy the rumor, sell the news."
Position: N/A
Ron Walker
Ron Walker is an active trader and technical analyst. He operates an educational website dedicated to the study of Technical Analysis. The website offers free market analysis with daily video presentations and written commentaries. Ron is a video pioneer, being one of the first to utilize the internet producing Technical Analysis videos. His website is thechartpatterntrader.com
PRINT THIS ARTICLE
CANDLESTICK CHARTING
A Dark Cloud Cover Over The Health Care ETF
01/22/10 09:07:45 AMby Ron Walker
The health care exchange traded fund has recently had an explosive move higher as the politicians battle it out over health care. Even though there is no bipartisan support for the health care bill, there has been bipartisan support among investors to run up the health care ETF. But with the most recent thrust upward, and speculation about the bill dying, traders might be wise to apply the old strategy of "Buy the rumor, sell the news."
Position: N/A
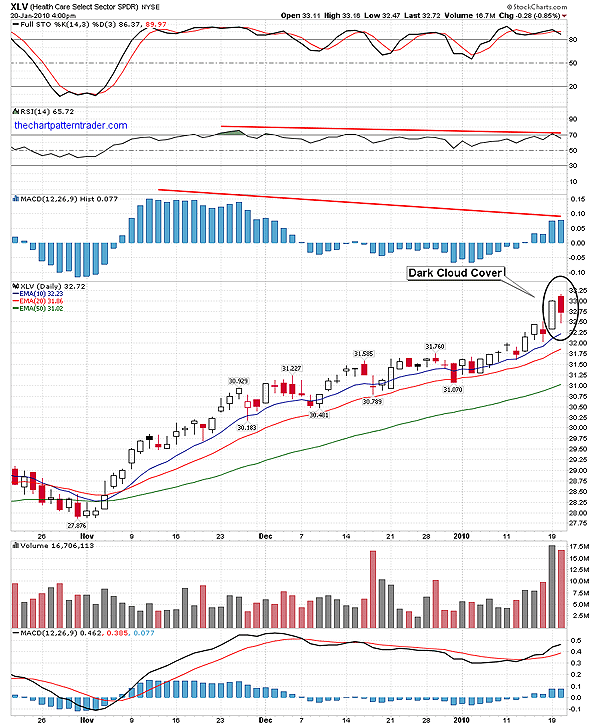
| The Health Care Select Sector SPDR (XLV) exchange traded fund (ETF) has been trending higher as US politicians debate health care. The Democrats seek to pass a health care bill, while the Republicans oppose the health care bill in its current form. Health care bills have been passed in both the House of Representatives and the Senate but must undergo reconciliation to produce one final bill. But the bill may be dead even before it completes the reconciliation process. While the Democrats were trying to reconcile the House and Senate health care bills, they lost their supermajority (the 60 votes in the Senate necessary to pass health care) when Republican Scott Brown won the Massachusetts Senate seat previously held by the late Democratic Senator Ted Kennedy in a special election. Brown vowed to unite with Republicans in opposing the bill. With the bill likely dead, the health care ETF may die along with it as XLV stalls at key resistance on the weekly chart as a bearish candle pattern lingers over the daily chart (Figure 1). |

|
| FIGURE 1: XLV, DAILY. A dark cloud cover candle pattern looms over the daily chart of XLV. Bearish divergences on the RSI and the MACD histogram with price suggests that a reversal may be in store for the health care ETF. |
| Graphic provided by: StockCharts.com. |
| |
| Figure 1 shows a dark cloud cover candle pattern looming over XLV. Note on the day of the election, XLV surged approximately 2.5% on speculation of a Brown victory. Many speculated that would stop the health care bill, but this may have been nothing more than the old "buy the rumor, sell the news" play. The day after the election, prices gapped up at the open but closed deep within the election-day candle. Meanwhile, the relative strength index (RSI) (14) and stochastic (14, 3, 3) formed bearish divergences with XLF. The moving average convergence/divergence (MACD) histogram (12, 26, 9 ) could be setting up a lower peak. If the dark cloud cover candle pattern receives a confirm close below $32.33 (Figure 1), the lowest point of the two-day pattern, then the moving average convergence/divergence (MACD) histogram may well form a lower peak and complete a pattern that resembles m-M-m and shift its slope. This arrangement of letters is a code used to identify short-term shifts in momentum on the histogram. The relationship of the last two histogram bars is represented by M-m, which defines a change in the slope in the vertical bars, representing bearish momentum. |

|
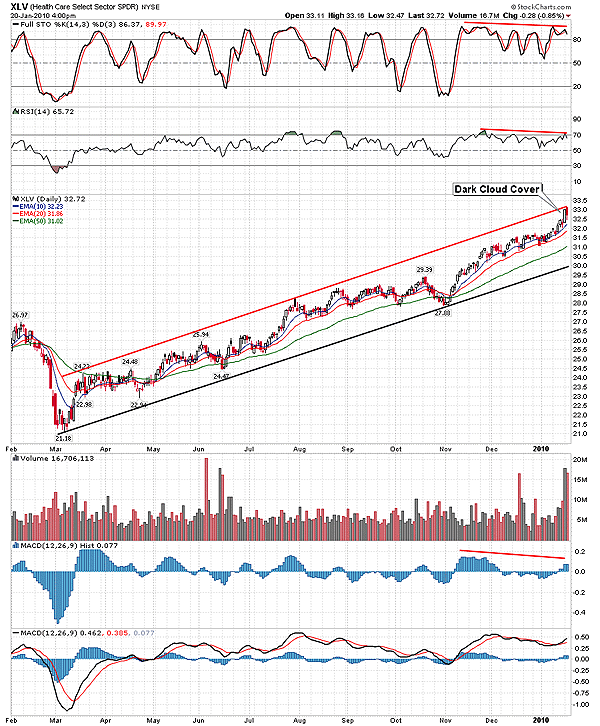
| FIGURE 2: XLV, DAILY. Looking at the bigger picture on the daily chart reveals that XLV has a mature trend. Note that the dark cloud cover pattern has collided with the upper channel line, while bearish divergences appear to be under construction. |
| Graphic provided by: StockCharts.com. |
| |
| Figure 2 shows XLV in a mature trend on its daily chart, as it is currently colliding into the upper part of the long-term rising channel. By testing the upper boundary of the channel, it could produce a reaction and allow the bearish dark cloud cover candle pattern to run its course. |

|
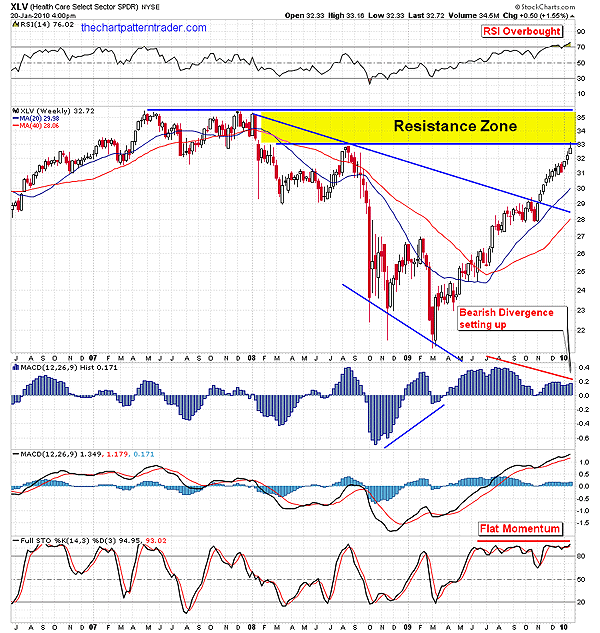
| FIGURE 3: XLV, WEEKLY. The weekly chart of XLV shows even more resistance, with a horizontal zone of resistance directly overhead. The lower tower on the histogram and flat momentum on the stocastic suggests that prices may retreat at the resistance zone. |
| Graphic provided by: StockCharts.com. |
| |
| Figure 3 showcases the weekly chart of XLV, which has managed to creep up to the resistance zone that resides between the $33 to 35.50 area. This is a huge obstacle for XLV to overcome, increasing the odds of the bearish candle pattern even more. But the weekly indicators are still bullish. The MACD (12, 26, 9) shows no signs of rolling over yet, and histogram bars are still rising. However, the RSI is newly overbought, suggesting that prices are overheated. Should the dark cloud cover pattern be confirmed and drag prices lower in the daily time frame, it could begin to weaken the indicators on the weekly chart. The resistance zone on the weekly chart may just be too much for XLV to overcome, which may be why the dark cloud cover formed in the first place. |
| The thing I found most interesting about the health care ETF is that it rose when it looked like the health care bill might pass in November and December. And it rose in January when it looked like the bill might be killed on speculation of the Democrats losing their supermajority two weeks prior to the Massachusetts special election. Speculators in favor of the bill bought on the rumor that health care stocks would rise with the implementation and requirement of mandatory insurance in the US. Speculators opposed to the bill bought in January in anticipation that the health care bill would die, allowing the private sector to remain unregulated by government bureaucracy. If this election did put the final nail in the coffin for the health care bill, it will be interesting to see how XLV reacts to that news over the long haul. Despite whichever side of the aisle we may be on, there is no denying the XLV has been a great investment for Democrat, Republican, and independent investors alike as XLV has proven to be a bipartisan ETF, where all investors can make a profit. |
Ron Walker is an active trader and technical analyst. He operates an educational website dedicated to the study of Technical Analysis. The website offers free market analysis with daily video presentations and written commentaries. Ron is a video pioneer, being one of the first to utilize the internet producing Technical Analysis videos. His website is thechartpatterntrader.com
| Website: | thechartpatterntrader.com |
| E-mail address: | thechartpatterntrader@gmail.com |
Click here for more information about our publications!
Comments
Date: 01/24/10Rank: 2Comment:

Request Information From Our Sponsors
- VectorVest, Inc.
- Executive Premier Workshop
- One-Day Options Course
- OptionsPro
- Retirement Income Workshop
- Sure-Fire Trading Systems (VectorVest, Inc.)
- Trading as a Business Workshop
- VectorVest 7 EOD
- VectorVest 7 RealTime/IntraDay
- VectorVest AutoTester
- VectorVest Educational Services
- VectorVest OnLine
- VectorVest Options Analyzer
- VectorVest ProGraphics v6.0
- VectorVest ProTrader 7
- VectorVest RealTime Derby Tool
- VectorVest Simulator
- VectorVest Variator
- VectorVest Watchdog
- StockCharts.com, Inc.
- Candle Patterns
- Candlestick Charting Explained
- Intermarket Technical Analysis
- John Murphy on Chart Analysis
- John Murphy's Chart Pattern Recognition
- John Murphy's Market Message
- MurphyExplainsMarketAnalysis-Intermarket Analysis
- MurphyExplainsMarketAnalysis-Visual Analysis
- StockCharts.com
- Technical Analysis of the Financial Markets
- The Visual Investor
